
Our funding comes from our readers, and we may earn a commission if you make a purchase through the links on our website.
The Best Azure Monitoring Tools
UPDATED: June 16, 2023
As organizations grow their cloud-based networks, they may find that they need more control and visibility into their environments. Microsoft Azure is one of the leading cloud platforms, and in this article, we’ll explore all of the tools sysadmin can use to monitor, maintain, and centralize their cloud-based services.
Here is our list of the best Azure monitoring tools:
- Turbo360 – EDITOR’S CHOICE This package of Azure monitoring tools interprets Azure resources into applications and applies business process activity mapping across subscriptions. The system is available as a SaaS package, a virtual machine for on-site installation, or as an Azure service. Start a 15-day free trial.
- SolarWinds Server & Application Monitor – FREE TRIAL Offers the best combination of cloud and on-premises monitoring with easy Azure integrations.
- AppOptics – FREE TRIAL Offers high-level Azure monitoring insights as well a code level look into the application stack.
- ManageEngine Application Manager – FREE TRIAL Uses a simple design to make managing multiple cloud environments simpler.
- Site24x7 – FREE TRIAL Infrastructure Monitoring – A full monitoring suite for multiple platforms that thoroughly covers all of Azure’s services.
- ManageEngine ADAudit Plus – FREE TRIAL This software package implements user behavior analysis, file integrity monitoring, and Active Directory protection. Available for Windows Server, AWS, and Azure.
- Paessler PRTG – FREE TRIAL Features custom sensors for Azure, and is a good choice for organizations that need monitoring elsewhere in their network.
- Datadog Cloud Monitoring Powerful cloud-based monitoring that combines out-of-the-box reporting with elegant visualizations.
- Dynatrace Uses cutting-edge AI and machine learning techniques to aid administrators in troubleshooting.
- Opsview Provides a detailed look into the infrastructure and application health of the Microsoft Azure cloud.
The Best Azure Monitoring Tools
1. Turbo360 – FREE TRIAL
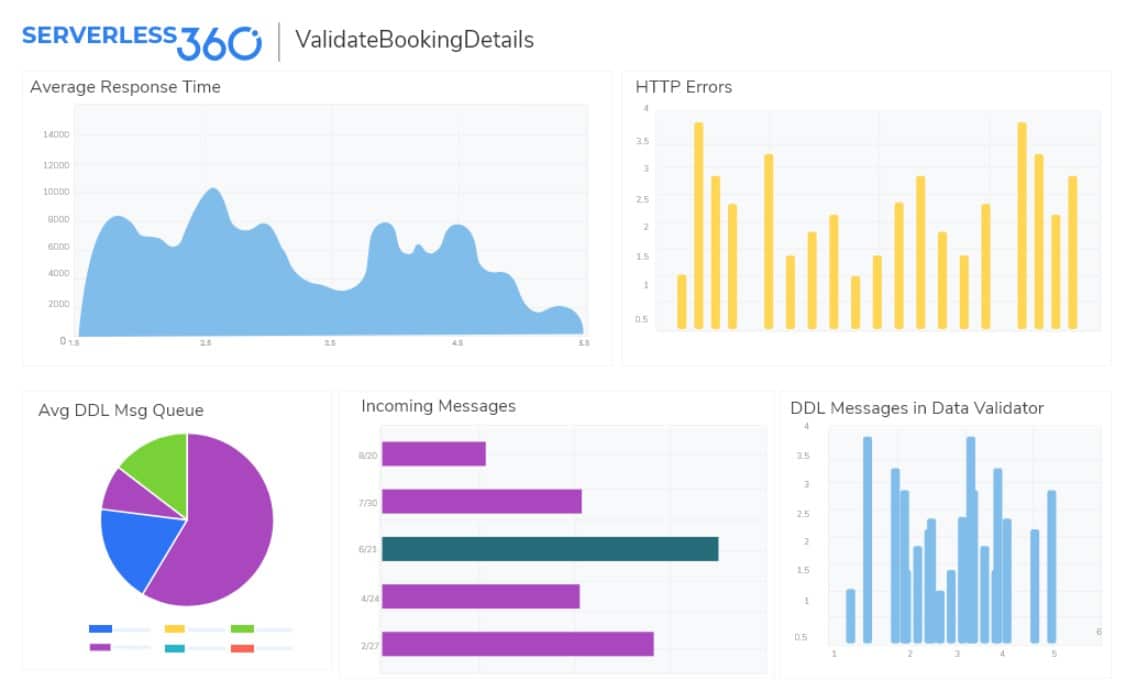
Turbo360 (formerly Serverless360) is a cloud management tool engineered for Azure. It addresses the observability challenge in cloud adoption with the representation of Azure resources as business applications with real-time status of the resources. Along with visualization and monitoring, Turbo360 offers the operational tool-set to fix the issue.
It is a package of three modules that make monitoring Azure services easier. Each module can be subs ripped to individually, but if you choose two or all of them, The Turbo360 modules are Business Applications, Business Activity Monitoring, and Azure Documentation.
The Business Application module maps each service into a presentation as an application. This makes monitoring those Azure services much more like the monitoring that you would expect for your on-site systems.
Key features:
-
Grouping and mapping Azure services
- Cross-platform distributed tracing
- Performance alerts
- Operations tool-set
- Automated tasks
No application operates in isolation, and the Turbo360 Business Application allows you to group Azure services into a business application, offering an operation-friendly view on the resources, which could be distributed on many subscriptions. It is also possible to drill down within the global application’s cover and look at the performance of each component for meeting operational business needs.
Think of the business application as a sub-assembly because this package will interact with other services within your system. So, you will still need an application dependency map to see how all of your logical applications interact. Turbo360 provides that dependency map.
Each service or business application group can have performance thresholds drawn against any metrics that track its performance. If one of those levels gets breached, the Turbo360 system will alert forwarded to you as a notification by Slack, PagerDuty, Webhook, or Microsoft Teams. It is also possible to initiate custom to set automated actions to be performed on the triggering of an alert using the Webhook notification channel.
The Business Activity Monitoring unit is a distributed tracing service that generates extra performance notifications to supplement the log messages provided by the Azure platform. This performance monitor crosses platforms, so it doesn’t matter where other elements in the application dependency chain are located. It follows business processes as they flow through applications and services. The Business Activity Monitoring system also provides instant root cause analysis data if things go wrong.
The Azure Documenter keeps track of your metered services. You can assess how many resources you have used during the day and check your Azure bill against that information.
Pros:
- Stunning data visualizations and simple admin console
- Flexible subscription options for any size Azure environment
- Designed to audit, monitor, and report on Azure applications
- Can automatically create dependency maps
- Supports monitoring for other environments and microservices
Cons:
- Could benefit from a longer trial period
Turbo360 also provides a business activity monitoring solution for end-to-end tracking of message flow across Azure resources. Turbo360 offers two hosting options; SaaS or private hosting in a customer’s Azure subscription.
Pricing:
- Business Application monitoring – $150, per month – billed annually
- Business Activity Monitoring package – $300 per month – billed annually
- Azure Documenter starts at just $49 per month – billed annually
All three modules of Turbo360 are offered on a SaaS platform. You can also get the software deployed in your Azure subscription. You can check out the free demo for all three Turbo360 modules, and you can also get a 15-day free trial.
EDITOR'S CHOICE
Turbo360 is our top pick for an Azure monitoring tool because it creates solid logical application views seamlessly constructed from siloed Azure services. The tool will map those logical applications and put them into context, showing which other services and applications they interact with. The activity monitoring system in the platform traces the message flow in the business processes across services. Turbo360 provides performance alerts and automated tasks to lighten the work of keeping your Azure-based system running smoothly.
Download: Start a 15-day FREE Trial
Official Site: https://turbo360.com/signup
OS: SaaS, Azure service, or virtual appliance
2. SolarWinds Server & Application Monitor – FREE TRIAL
SolarWinds Server & Application Monitor (SAM) is a flexible monitoring platform that uses sensors to monitor cloud, multi-cloud, and on-premises environments. With SAM, administrators can centrally monitor their Azure cloud resources as well as view insights into other areas of their local network, or other platforms.
Key features:
- Azure monitoring plus on-site monitoring
- Intelligent reporting
- Infrastructure and application correlation
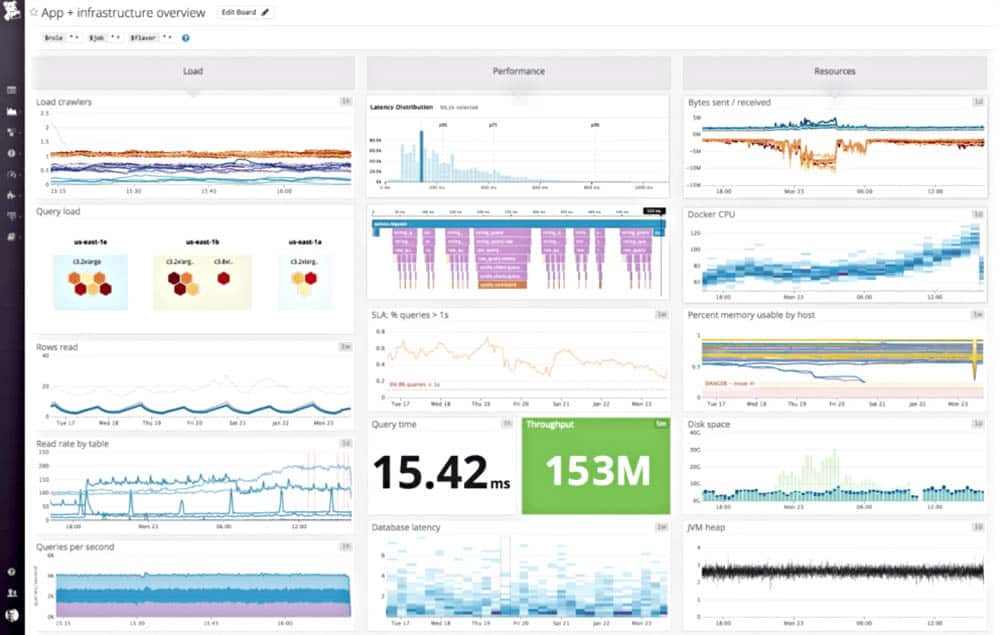
Upon deployment, the platform automatically discovers virtual machines, servers, and services across the Azure cloud and begins pulling down metrics and analysis into a single centralized dashboard. From here, pre-configured reporting and metrics are offered out of the box allowing you to receive instant insights into your Azure cloud environment.
For further customization, the dashboard is able to be tailored to specific views with a drag and drop modular system. These saved views can then be applied to individual team members, or certain groups, ensuring everyone is monitoring the metrics that move the dial.
SolarWinds SAM also utilizes dynamic baseline metric tracking and intelligent alerting to help reduce alert fatigue and cut down on repetitive non-essential alerts. Alerts notify teams or points of contact in real-time via email, API integration, or third-party apps such as Slack. Long-term metrics tracking data captured in SAM can be stored and then compared to give administrators a long-term look at how their Azure environment has performed over time.
The platform also lets you easily view and separate infrastructure metrics from application insights, giving you the ability to monitor both while drawing a correlation between infrastructure events, application performance, and ultimately the user experience.
Pros:
- Can monitor Azure, as well as numerous other cloud and local server environments
- Supports auto-discovery that builds network topology maps and inventory lists in real-time based on devices that enter the network
- Offers flexible alerting features and a wide range of integrations
- Uses drag and drop widgets to customize the look and feel of the dashboard
- Robust reporting system with pre-configured templates
Cons:
- Designed for IT professionals, not the best option for non-technical users
SolarWinds Server & Application Monitor starts at $1622 per year and is available to test out for free through a 30-day trial.
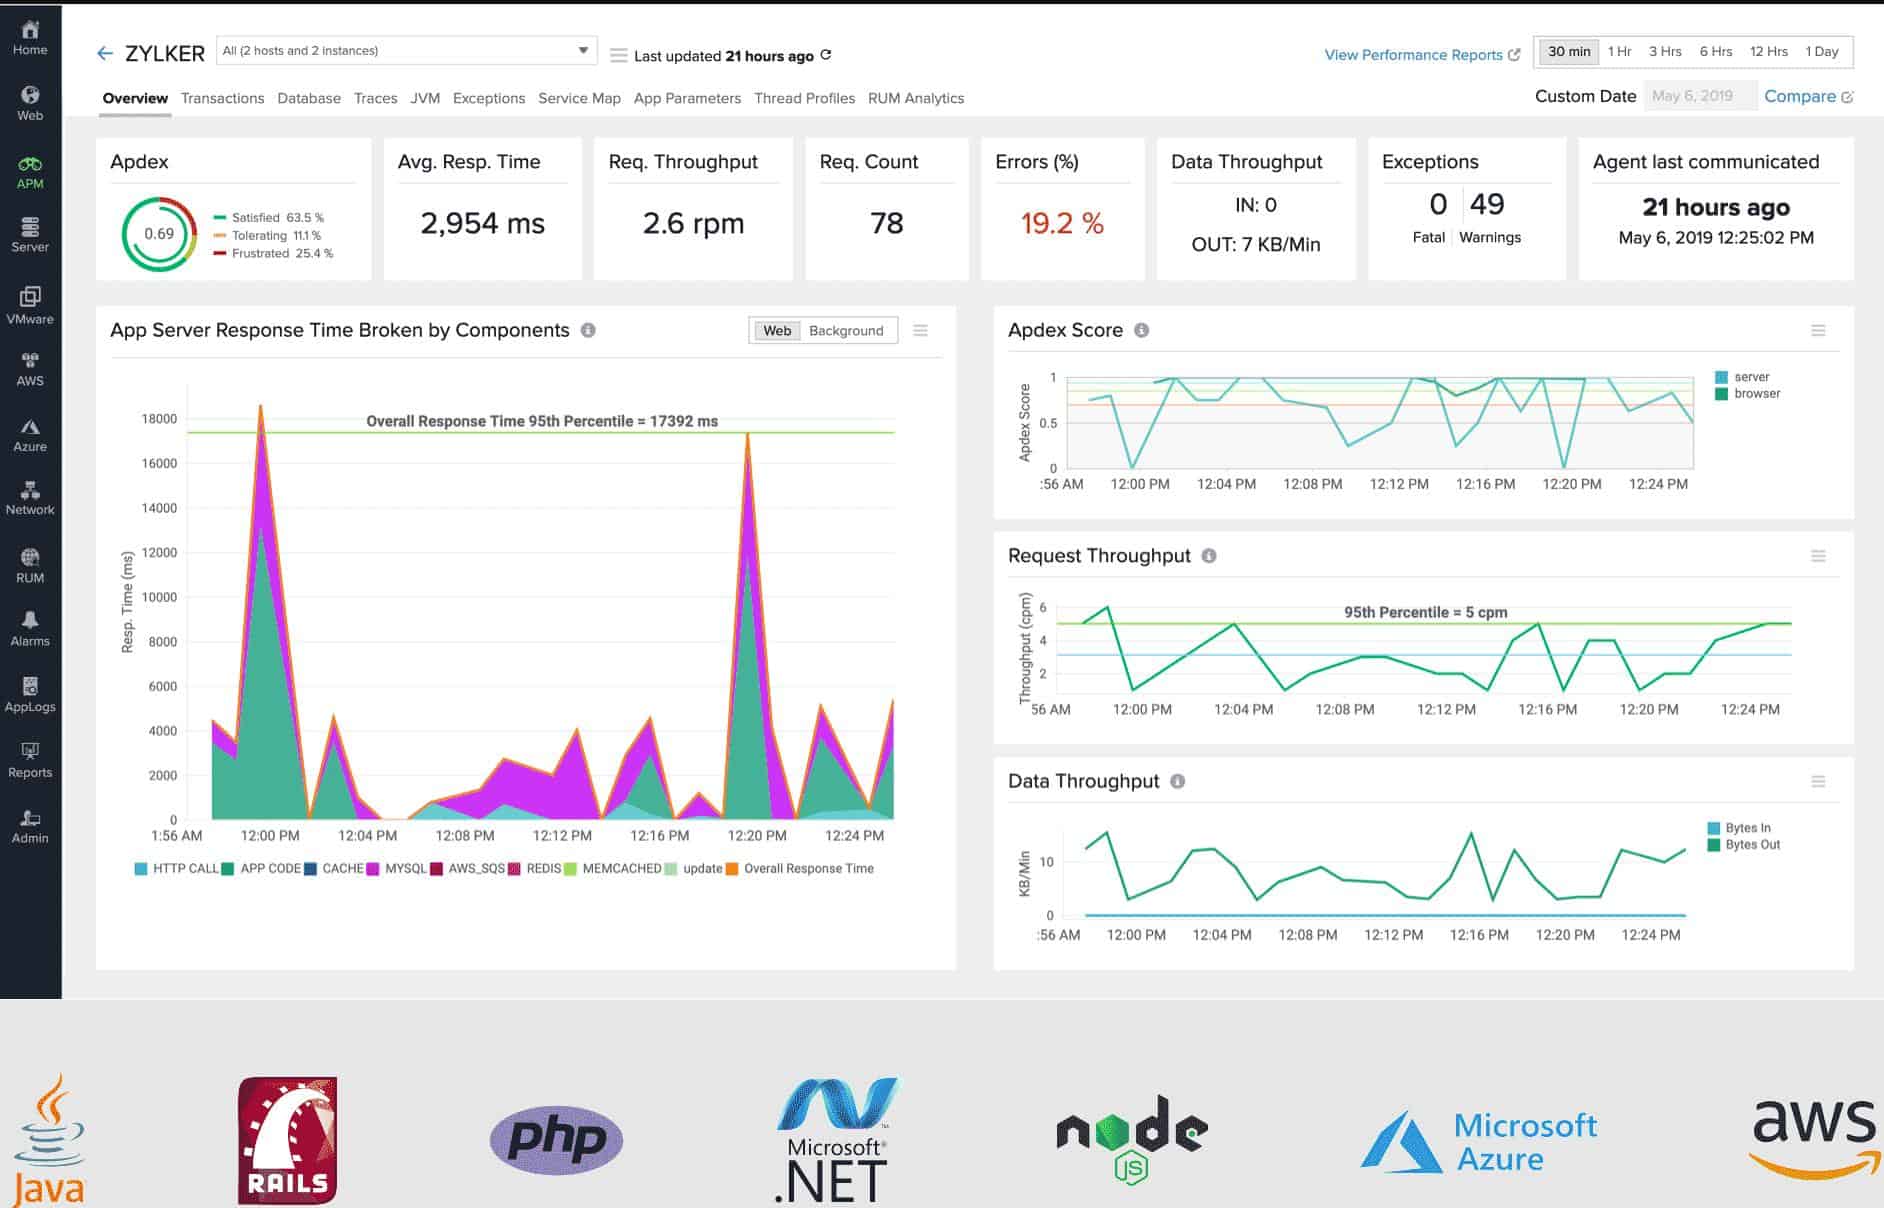
3. AppOptics – FREE TRIAL
The AppOptics platform by SolarWinds offers a deep look into Azure cloud environments and boasts enterprise features to help administrators manage, monitor, and optimize their multi-cloud or hybrid environments. AppOptics is especially valuable for developers who are looking for Azure monitoring paired with troubleshooting tools such as live code profiling, and code-level analysis tools.
Key features:
- Root cause analysis
- Code-level troubleshooting tools
- Prebuilt alert templates
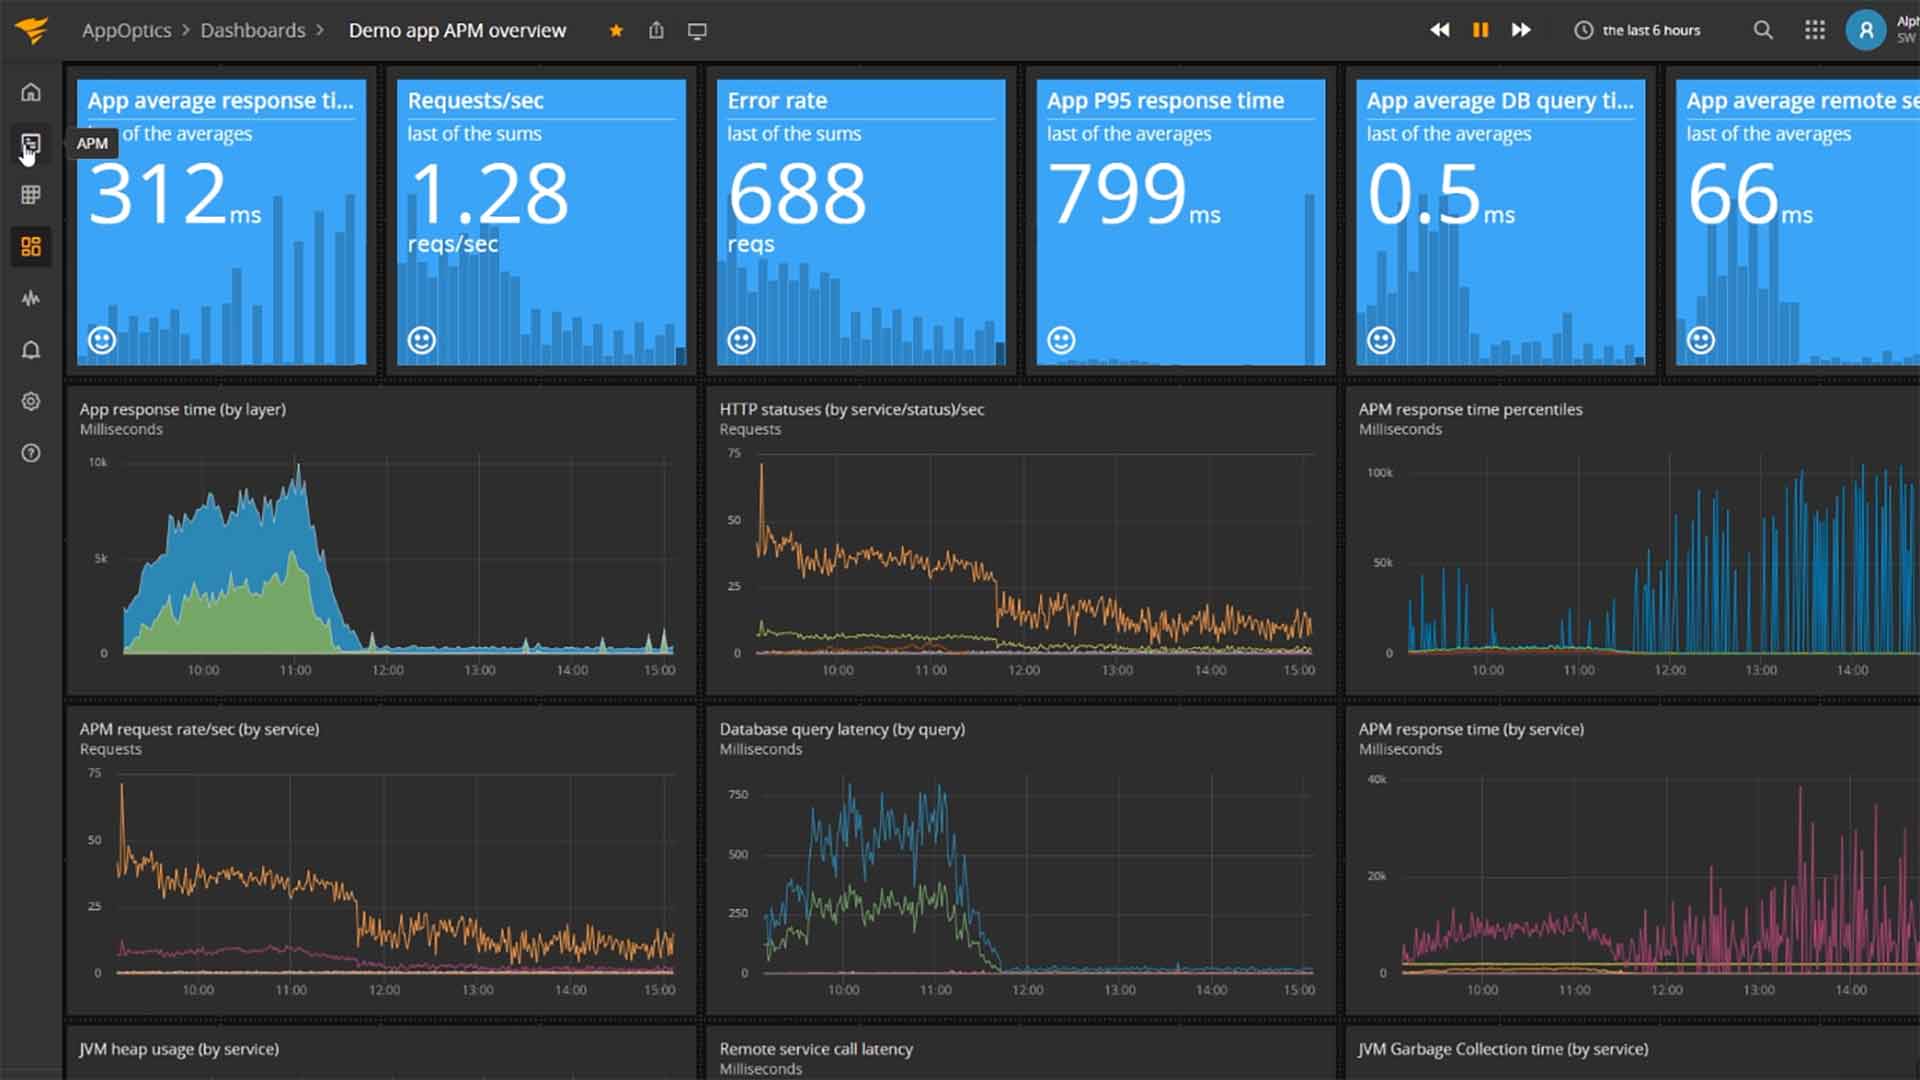
Monitors can be deployed in Azure virtual machines or inside containers for data collection. Once that data is collected, pre-configured dashboards work to turn data into actionable insights for admins or development teams. The default dashboard provides a solid look into both your infrastructure as well as application performance. Metrics like CPU, memory usage, network resources, traffic flow, and service status are easily monitored and filtered with custom widgets and visualizations.
Proactive alerts can be configured via email, SMS, Slack, or other third-party applications like Pagerduty. The alert library has templates with thresholds and conditions already configured for the most common issues within the Azure cloud which allows you to easily get positioned using proactive monitoring as quickly as possible. While there a number of alert templates available, custom alerts can be built through a straightforward wizard that lets you choose thresholds, conditions, and objects to monitor,
When looking at manual troubleshooting options AppOptics has a host of tools that are usually only found in development tools, and not included in monitoring platforms. Distributed tracing allows you to pinpoint the exact source of a problem or exception in just a few minutes. Easy toggles from top-level health insights to live code view get issues resolved even faster.
Pros:
- Offers a live look into the health of your Azure environment
- Offers great visualizations reflecting live and historical health metrics and resource consumption
- Deploys as a flexible cloud service
Cons:
- Would like to see a longer trial period
Infrastructure and application monitoring starts at $24.99 per month and includes distributed tracing, live code profiling, and trace level root cause analysis in addition to Azure monitoring. Start out with a 30-day free trial.
4. ManageEngine Applications Manager – FREE TRIAL
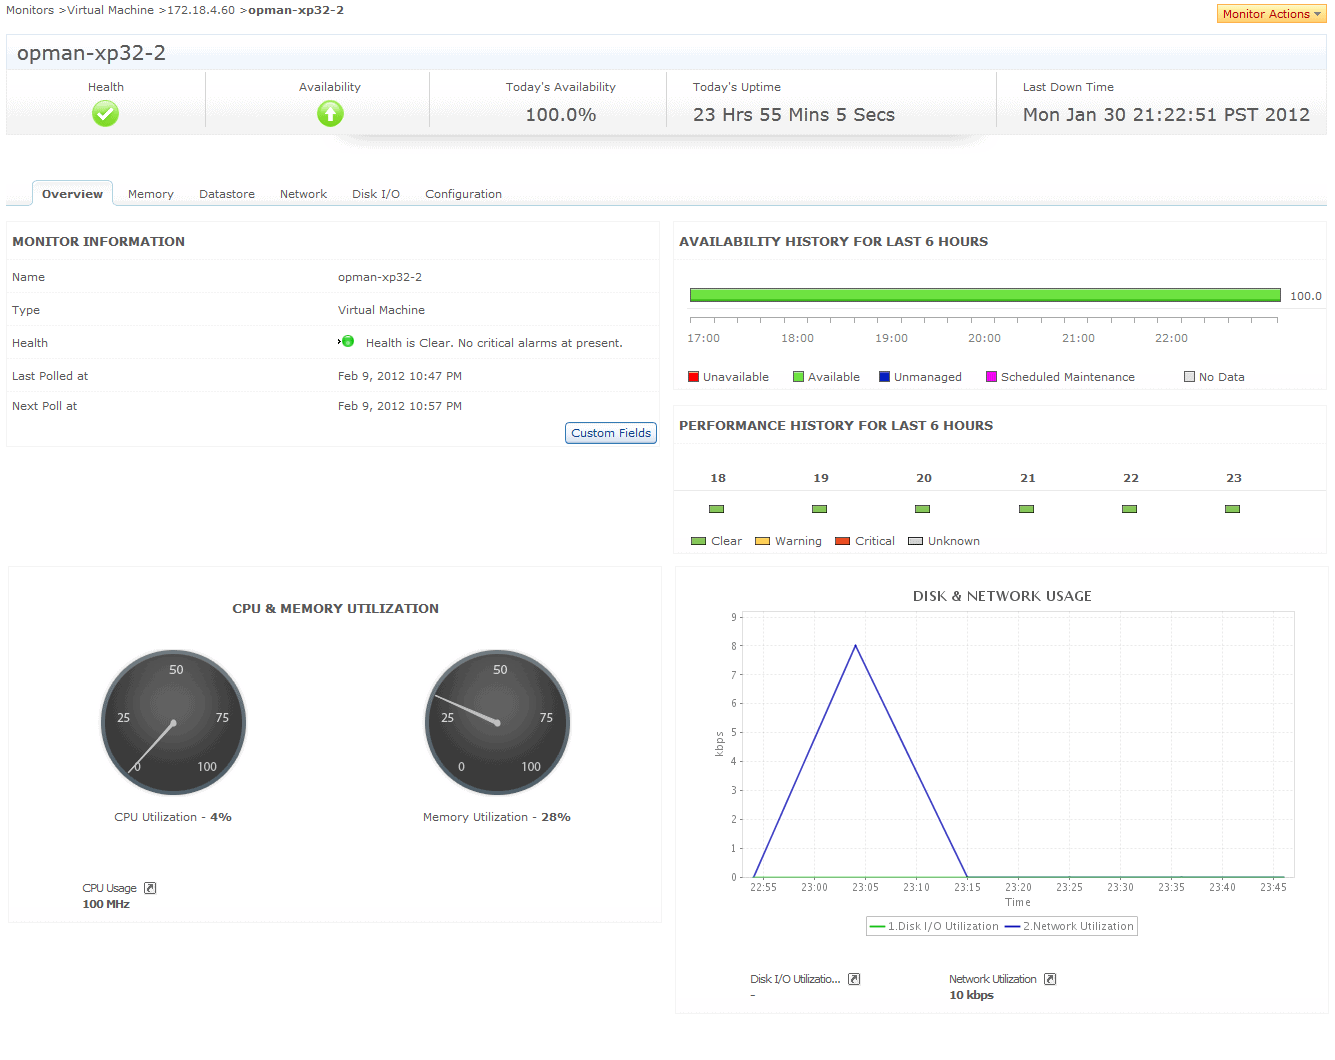
ManageEngine Applications Manager offers a custom integration directly into Azure that ensures you’re getting real-time metrics and insights. The platform can track the status of specific applications, services, or the overall cloud infrastructure. As some of the tools mentioned earlier, ManageEngine is a complete APM suite that offers multiple forms of monitoring for both in the cloud as well as on-premises.
Key features:
- Instant alerts
- Multiple licensing options
- Cloud and on-premises monitoring
The tool uses a minimalist dashboard that helps keep the dashboard organized and easy to read, even when managing multiple cloud environments at the same time. Metrics in Azure like memory usage and CPU utilization is all easily trackable along with contextual information like most used services, and top utilized virtual machines. While the dashboard and reporting are simple on the surface, detailed reports and visualizations can still be created with relative ease in just a few minutes.
You’ll find some Azure monitoring solutions send out alerts intervals which can cause a delay between a service being down and the time you’re notified. ManageEngine Application Manager works to send out alerts as soon as anomalies are detected, or thresholds are broken.
Pricing for ManageEngine Application Manager is available in two tiers, Professional and Enterprise Edition. The cost will vary depending on your organization's size and is closely tied to the number of monitors you wish to deploy.
Pros:
- Offers on-premise and cloud deployment options, giving companies more choices for install
- Can highlight interdependencies between applications to map out how performance issues can impact businesses operations
- Offers log monitoring to track Azure metrics like memory usage, disk IO, and cache status, providing a holistic view into your database health
- Can automatically detect databases, server hardware, and devices for real-time asset management
Cons:
- Can take time to fully explore all features and options available
Licensing is available in both subscription and perpetual form. A free 30-day trial with all features enabled can be downloaded free. Once the trial expires your account will be downgraded to the free version of the platform.
5. Site24x7 Infrastructure Monitoring – FREE TRIAL
Site24x7 offers an application performance and infrastructure monitoring tool available through a simple cloud service. The entire platform is designed to offer end-to-end monitoring for all applications or servers, making this a great option for organizations who are looking to implement some form of centralized monitoring across their Azure clouds as well as other parts of their networks.
Key features:
- Cloud-based Azure monitoring
- Flexible pricing
- Drag and drop customizations
Through a single account, you can monitor multiple servers, applications, or even clients, making this a great choice for MSPs who are looking to offer Azure monitoring services to their list of offerings. Since Site24x7 is cloud-based, management and monitoring are available through any web browser with an internet connection.
Everything about the platform is designed with ease in mind. Everything from reporting to metrics visualization in the dashboard utilizes simple drag and drop elements to get the platform to look and perform how you want it to.
A unique feature in Site24x7 is its live topological map that is automatically built as its agents find new devices, servers, or containers. This helps you as well as helpdesk teams visualize the Azure cloud environment and quickly identify bottlenecks or individual issues.
Pros:
- Provides templated Azure monitors, reports, and dashboards
- Uses real-time data to discover devices and build charts, network maps, and inventory reports
- Is one of the most user-friendly network monitoring tools available
- User monitoring can help bridge the gap between technical issues, user behavior, and business metrics
- Supports a freeware version for testing
Cons:
- Is a very detailed platform that will require time to fully learn all of its features and options
The platform keeps pricing simple and starts at $9.00 per month when billed annually. Upgrades are modular, and allow you to choose what you need through an al-la-carte selection, ensuring you’re only paying for the services and features you actually use. Start with a 30-day free trial.
6. ManageEngine ADAudit Plus – FREE TRIAL
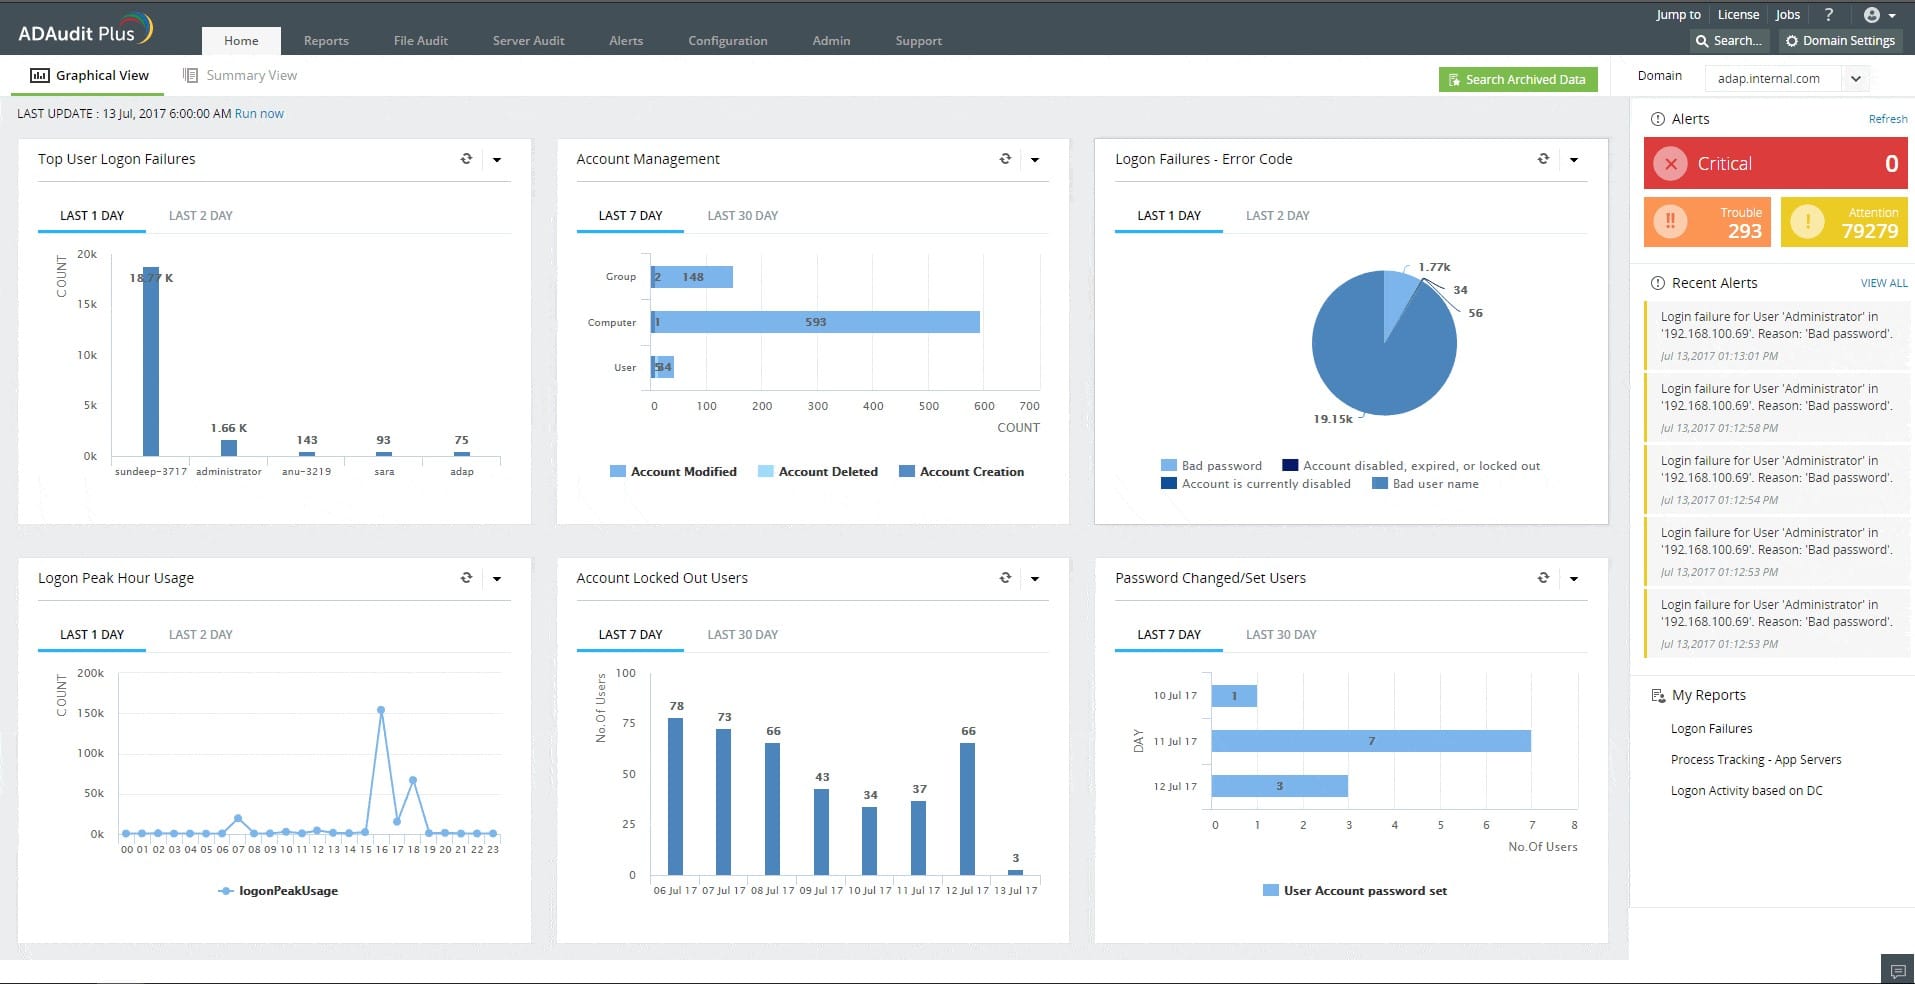
ManageEngine ADAudit Plus is an activity monitoring package that links into Active Directory records. This tool can run on Azure and use implementations of Azure AD for reference. The system is also available for AWS.
Key features:
- Protects Active Directory against tampering
- Implements user behavior analytics
- Logs file access events
Azure monitoring tools fall into many categories. The ADAudit Plus system deals with file activity monitoring. The tool doesn’t block access to files – that is a task for your Active Directory domain controllers. This is why protection for Active Directory is an important part of the ADAudit Plus package.
You can use the ADAudit Plus system to implement automated responses. However, these actions are not built into the tool by default – you have to set up these actions manually. For example, the system will record access to all files. However, this will only be a serious action for files containing sensitive data that is governed by data protection standards. The auditing functions of ADAudit Plus can be pre-set to fit in with the requirements of specific standards. These capabilities include compliance with SOX, HIPAA, PCI-DSS, FISMA, and GLBA.
Pros:
- Activity tracking and logging
- Identification of the user account involved in each file access action
- Protection for the user account settings in Active Directory
- Compliance reporting
- Templates for specific data protection standards
- Opportunities for automated responses.
Cons:
- This isn’t a SaaS package
ManageEngine ADAudit Plus can be installed on Windows Server and it is available as a service on AWS or Azure. A Free edition provides activity logging for up to 25 workstations and also includes compliance reporting. Azure can be monitored with the Standard edition and the Professional edition adds in Active Directory change reporting. ManageEngine offers the Professional edition for a 30-day free trial.
7. Paessler PRTG – FREE TRIAL
Paessler PRTG offers Azure monitoring as well as on-premises and multi-cloud monitoring through multiple sensors that are customized to measure specific metrics depending on which environment it's monitoring. Paessler PRTG is a full APM suite containing hundreds of different sensor configurations, making this a good choice for large organizations that are looking to start centralizing their monitoring efforts.
Key features:
- Granular control over monitoring
- Simple visualization
- iOS and Android compatible app
All insights in the Azure cloud are made available through the PRTG platform through a number of ready-to-deploy Azure cloud sensors. As metrics pour in those insights are automatically added to your dashboard view giving you performance insights as early as possible.
Visualizations are simple, and display metrics through a series of log events, and gauges that help give cues to the performance of your applications and overall Azure infrastructure. Real-time scanning keeps an accurate catalog of containers, virtual machines, and services and adds them almost instantly into the PRTG dashboard as they are discovered.
Alerts are accessible through a range of mediums such as email, SMS, API integrations, and even push notifications through the PRTG mobile app on Android and iOS.
Pricing for PRTG starts with a limited free version that restricts you to 100 sensors. While this may sound like a lot, each sensor monitors a single metric, so it’s easy to use a dozen or so sensors to monitor a single application. This granularity gives large enterprise environments the ability to forecast and control their budget by choosing exactly what is worth monitoring and what isn’t.
Pros:
- Supports a wide range of cloud monitoring environments – great for companies using multiple cloud products
- Drag and drop editor makes it easy to build custom Azure views and reports
- Offers flexible integration with helpdesk systems and third-party messaging platforms
- Highly customizable sensors – great for building custom monitoring solutions
- Supports a robust freeware version
Cons:
- PRTG is designed with network professionals in mind – not ideal for non-technical users
The paid version of Paessler PRTG starts with the PRTG 500 tier, which offers 500 sensors and one server for $1750. Alternatively, you can contact the sales department for a more customized quote tailored to your environment. You can test out the full version of Paessler PRTG free with a 30-day free trial.
8. Datadog Cloud Monitoring
Datadog has been quick to rise through the ranks of cloud monitoring tools and is an excellent choice for monitoring Azure cloud applications, as well as managing and centralizing multi-cloud services.
Key features:
- Cloud-based Azure monitoring
- Out-of-the-box reports, dashboards, and integrations
- Machine learning-powered alerts
Datadog features a full in-depth Azure integration that allows for total observability into the Azure ecosystem. The platform offers monitoring support for over 40 Azure services and makes implementation simple through a plug-and-play style series of integrations. Deployment of the core collection agent can be done through an Azure virtual machine for more granular data collection.
The entire Datadog platform aims to provide sysadmins everything they need to start getting valuable insights from a Datadog monitoring product. With out-of-the-box report templates, dashboards, and third-party integrations, you can quickly receive actionable insights into Azure without spending a ton of time with a lengthy onboarding process.
The Datadog monitor can not only provide insights on applications and infrastructure, but also monitor the individual services running on Azure, like the Azure App Service, and the Azure Kubernetes Service. Through the API library, you can link alerts to route to help desk teams, or apply automation to restart services or execute particular scripts.
Pros:
- Can monitor Azure, along with other cloud and server environments
- Supports auto-discovery that builds network topology maps on the fly
- Changes made to the network are reflected in near real-time
- Allows businesses to scale their monitoring efforts reliably through flexible pricing options
Cons:
- Would like to see a longer trial period for testing
Monitoring both infrastructure and application metrics require the more advanced pricing plan that currently starts at $23.00 per month when billed annually. You can try out Datadog and all of its features completely free with a 14-day trial.
9. Dynatrace
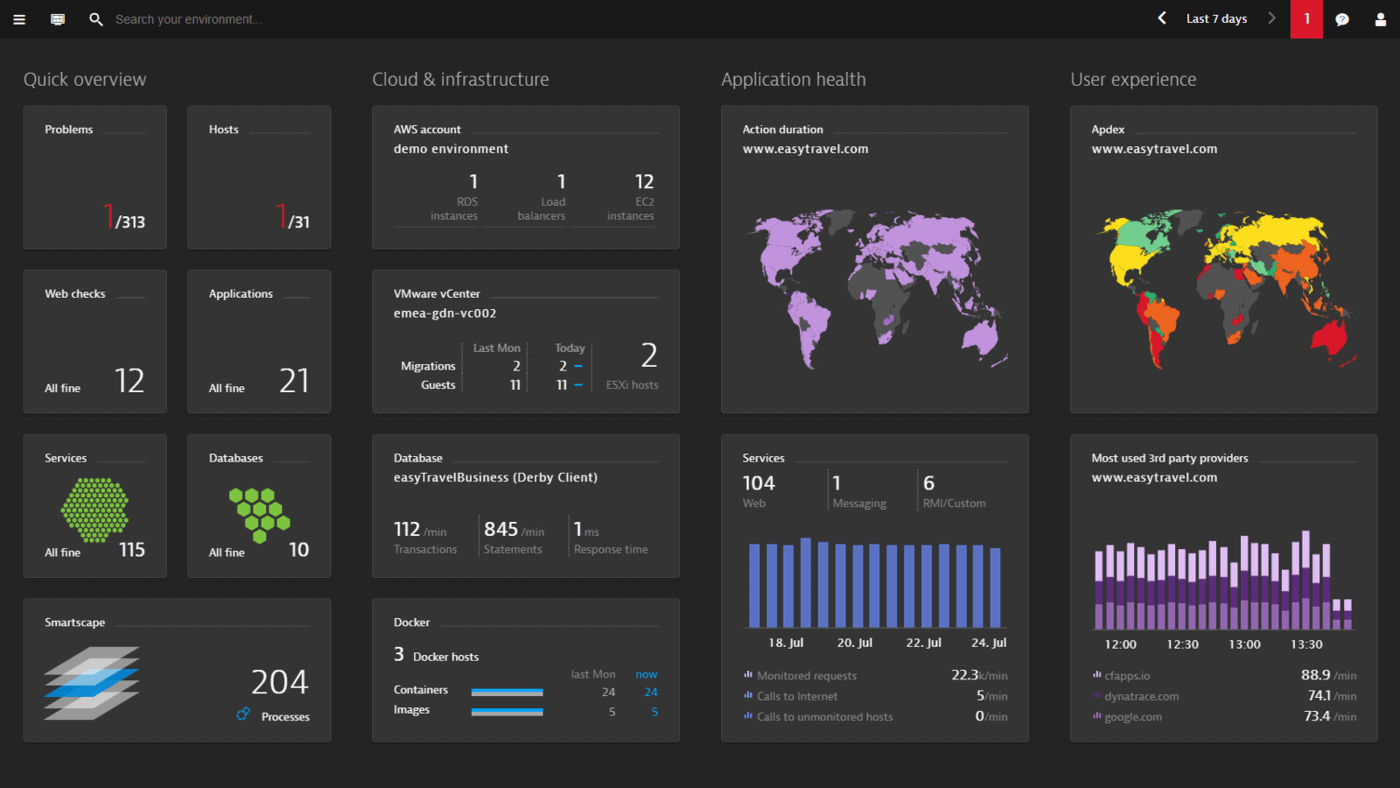
The Dynatrace platform uses advanced monitoring and comprehensive reporting into the entire Microsoft Azure environment. Dynatrace stands out by using automation and artificial intelligence-powered tools to significantly cut down on the day-to-day activities sysadmins find themselves performing.
Key features:
- AI-powered monitoring
- Intuitive dashboards and reporting
- Root cause analysis
In addition to monitoring the core application and infrastructure metrics in Microsoft Azure, the platform features advanced troubleshooting tools that leverage artificial intelligence and machine learning to provide IT teams with solutions next to their alerts.
This comes in the form of root cause analysis, dynamic baseline monitoring, and machine learning-powered alerting. Dynatrace gives organizations full-stack observability into their Azure environment combined with a code-level view through their troubleshooting tools. While many of these tools can seem intimidating to implement, Dynatrace does a great job of positioning these features to be as simple as possible to roll out.
Through the central home dashboard, you can view multiple services, servers, applications, or environments which can all be customized to your specific needs. All dashboard views on the platform are modular, and allow you to choose from numerous premade visualizations and reporting templates to make setup fast and easy.
Dynatrace strikes a balance by providing proactive AI-powered alerting with powerful reactive troubleshooting tools that help ensure critical Azure services remain up and running.
Pros:
- Supports a wide range of cloud monitoring environments – great for companies using multiple cloud products
- Drag and drop editor makes it easy to build custom Azure views and reports
- Offers flexible integration with helpdesk systems and third-party messaging platforms
- Highly customizable sensors – great for building custom monitoring solutions
- Supports a robust freeware version
Cons:
- PRTG is designed with network professionals in mind – not ideal for non-technical users
Pricing for Dynatrace is on the higher end when compared with other tools on this list, but utilizes the most amount of AI technology to streamline monitoring and troubleshooting. When billed annually Dynatrace starts at $69.00 per month for full-stack monitoring for cloud environments. Check out the free trial.
10. Opsview
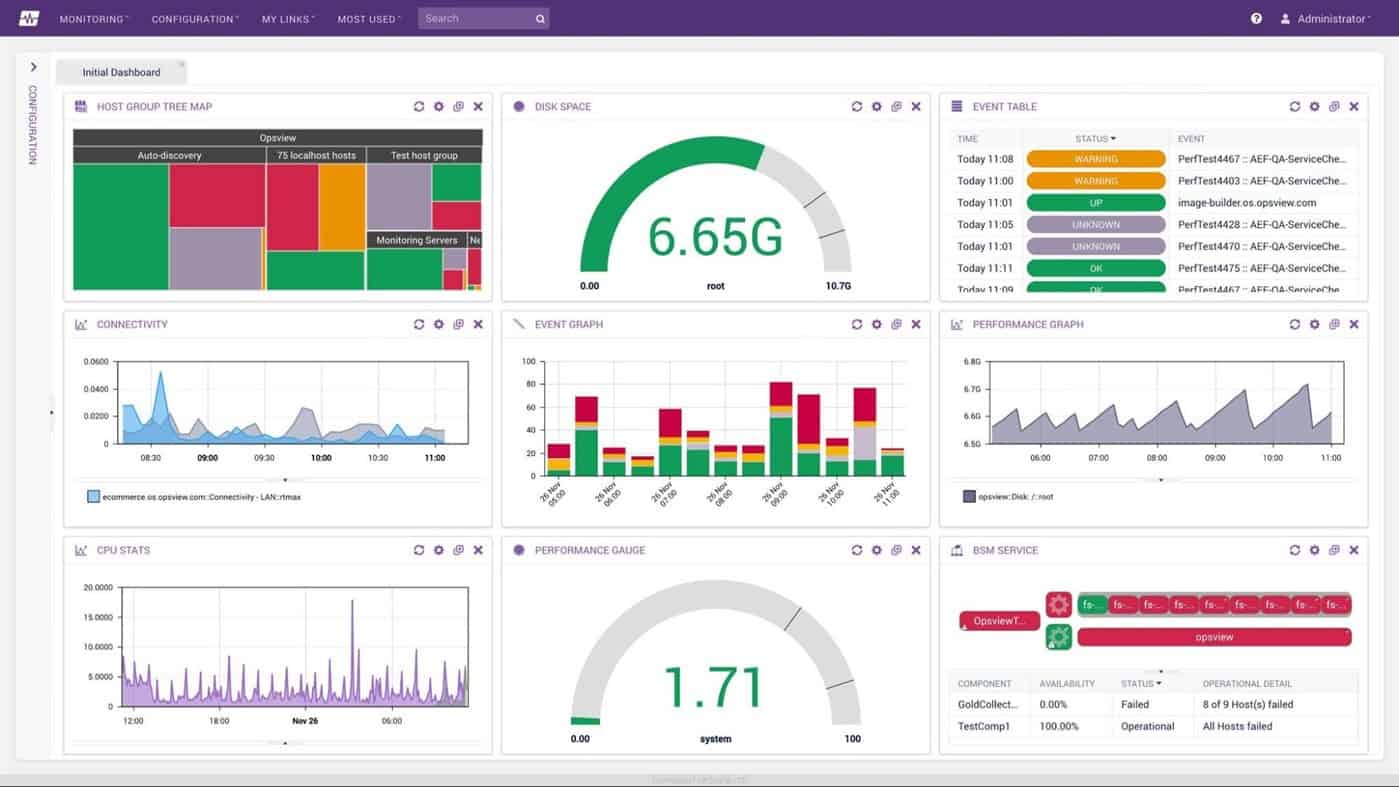 Opsview offers a centralized look into an organization's application performance and infrastructure monitoring across cloud and on-premises services. Opsview specifically makes monitoring Azure easy with Azure Express Scan. This scan simplifies the onboarding process with a wizard that quickly identifies Microsoft Azure objects across a subscription and auto imports them into the Opsview inventory.
Key features:
- Azure monitoring across all services
- Centralized monitoring
- A large number of integration options
Once inventoried, data will begin to populate the home dashboard with preconfigured insights giving you valuable information as soon as the scan is complete. As you add new virtual machines or containers to Azure Opsview automatically picks up on any new changes across the subscription and reflects that in the monitoring dashboard.
The platform does a great job of thoroughly ensuring that all areas of Azure are able to be monitored in the most amount of detail possible. This includes checks across virtual machines, containers, Elastic Pool, clusters, and app service plans.
Pros:
- Supports Azure monitoring as well as the monitoring of web services
- Great admin dashboards and monitors
- Clean easy to use interface
- Supports a free and paid version
Cons:
- Better suited for on-prem Azure monitoring
Pricing for Opsview Cloud monitoring isn’t publicly listed, accurate pricing information can be obtained by contacting the sales department. The Opsview Cloud tier starts at 150 hosts and supports integration into products like Splunk, Slack, OTROS as well as automation platforms like Ansible and Puppet. They also offer a free trial.
Choosing the right Azure Monitoring Software
In this article we touched on the best Azure monitoring software tools, but which one is the best fit for you?
For almost all organizations SolarWinds Server & Application Monitor is going to provide the best option for Azure monitoring capabilities. The platform allows you to monitor Azure, as well as other on-premises or multi-cloud environments which gives you the freedom to keep your monitoring solution if you ever move away from Azure in the future.
For businesses looking for a holistic cloud-based monitoring solution, Datadog offers some of the simplest integrations and of the box features for not just Azure monitoring, but for a wide range of monitoring needs.
Are you happy with how you’re currently monitoring your Azure cloud? Let us know why or why not in the comments below.

