
Our funding comes from our readers, and we may earn a commission if you make a purchase through the links on our website.
The Best AIOps Platforms
UPDATED: December 21, 2023
AIOps platforms have one goal: To provide full AI capabilities for IT Operations. Still, the market for AIOps platforms is tremendously diverse. Every product varies in capabilities, target, requirements, price, and even architecture.
In this post, we’ll go through the best AIOps platforms in the market. Most of these products were born for slightly different purposes but all ended up turning into fantastic AIOps solutions that help bring AI into your operations.
Here is our list of the Best AIOps Platforms Tools:
- ManageEngine Analytics Plus – EDITOR’S CHOICE An analysis package to support capacity planning, project management, security analysis, and financial controls, using machine learning and graphical data interpretations. Available as a SaaS package or for installation on Windows Server or Linux. Get a 30-day free trial.
- ManageEngine OpManager Plus – FREE TRIAL This large package includes all of the ManageEngine network and server monitoring and management tools and provides AIOps features. Runs on Windows Server and Linux. Download the 30-day free trial.
- Site24x7 – FREE TRIAL A leading AIOps platform, leveraging AI for predictive analysis and automated IT operations optimization. Start a 30-day free trial.
- Datadog A cloud-based infrastructure management and monitoring platform. Datadog allows you to build automated AIOps workflows.
- Dynatrace An all-in-one intelligent APM solution with AI-backed capabilities.
- Cisco AppDynamics An advanced APM and IT operations analytics solution for cloud and on-premise environments.
- Splunk Enterprise An end-to-end service monitoring platform with powerful analytics and automation.
- PagerDuty A SaaS-based incident response platform that collects telemetry data and provides alerts using ML and automation.
- Logic Monitor A SaaS-based APM, network monitoring, and AIOps platform powered by LM intelligence.
- Instana Enterprise Observability An observability and APM platform designed for managing microservices and cloud-native applications.
- Big Panda An advanced event correlation and automation platform powered by AIOps.
- MicroFocus OpsBridge An automated event correlation and analysis, and APM powered by AIOps.
- Moogsoft A cloud-native AIOps and observability platform.
- Zenoss Cloud A SaaS-based intelligent application and service monitoring and AIOps solution.
- New Relic One An advanced cloud-based full-stack observability platform.
Why AIOps Platforms?
The objective of AIOps platforms is to empower IT and operations professionals with the data they need to make faster decisions, keep applications up and running, resolve issues immediately, and even discover insights.
AIOps platforms attempt to eliminate data silos by integrating data from different sources in a central place. From here, AIOps platforms can leverage monitoring and observability capabilities to provide the necessary engagement, context, and automation.
Key Components in AIOps Platforms?
According to the Market Guide from Gartner, AIOps platforms center around two main components, IT Operational Big Data and Machine Learning (ML). They help collect a wide range of data, generated from different sources and automatically detect and react to situations in real-time. AI Ops platforms run collected data over ML and data analytics to automate and improve IT operations.
- Data Sources Data is key for AIOps platforms. These platforms help aggregate data (real-time or historical) to provide monitoring or observability capabilities. This data can range from metrics, logs, events, alerts, and more.
- Discover and Monitor The collected data from such sources is centralized and fed to the AIOps platform. The platform can monitor based on specific baselines and thresholds and detect anomalies.
- Provide Engagement and Context The AIOps platform can take collected monitoring or observability data and provide context (what, who, why, etc), recommended actions, insights, predictions, and alerts. Some AIOps platforms can also ingest engagement data (tickets, incidents, etc) to provide IT Service Management (ITSM) capabilities.
- Act and automate Finally, AIOps platforms can combine collected data and run it through advanced analytics and ML. The results are automated outcomes for key IT functions, via scripts or run books.
The Best AIOps Platforms
The following AIOps platforms can use AI or Machine Learning to analyze large data volumes across different environments. They can improve the root cause analysis to proactively and reactively identify issues and provide a resolution.
Our methodology for selecting AIOps platforms
We reviewed various AlOps platforms and analyzed the options based on the following criteria:
- Integration support
- Effectiveness of AI and machine learning root cause analysis
- A facility to analyze performance over time
- Graphical interpretation of data, such as charts and graphs
- A free trial period, a demo, or a money-back guarantee for no-risk assessment
- A good price that reflects value for money when compared to the functions offered
1. ManageEngine Analytics Plus – FREE TRIAL
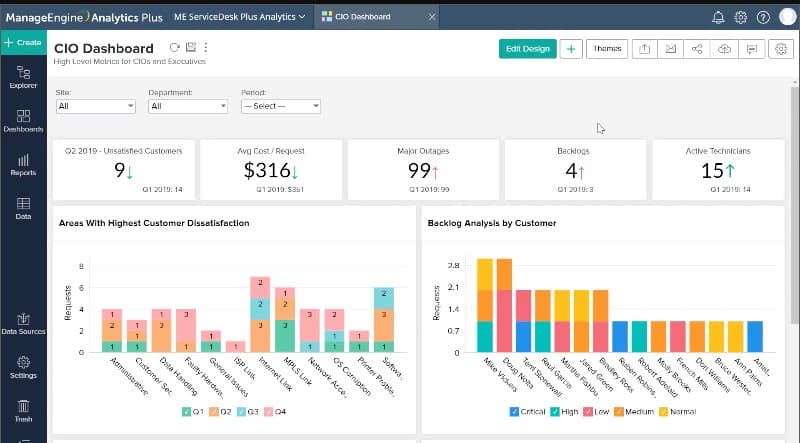
ManageEngine Analytics Plus provides an environment for operational analysis and development project tracking. The functions that this package supports include operations, finance, and security management. This is a good tool for protecting future requirements, thanks to the AI capabilities of the platform.
Key Features
- Gathers operational data
- Summarizes and sorts event data
- Uses AI to project demand
- Support security breach assessment
- Tracks budgets for operations and development
This package scrapes existing systems for data once an hour. This means that it isn’t intended for use as a live monitoring service. Instead, you would use the system for identifying trends. For example, you could see whether costs are being kept within budget or are likely to escalate. You can also use the package to track compliance with data protection standards, including HIPAA and GDPR.
Pros:
- Deployment options include a SaaS subscription or a permanent license for installation
- Track conformance to service level agreements
- Watch for divergence from HIPAA or GDPR requirements
- Identify trends in demand to increase or decrease resource capacity
- Right-size resources on cloud platforms
Cons:
- Although resource detection is automatic, cost and utilization expectations have to be entered
Licensing: The SaaS platform uses a subscription model with a rate per month, starting at $199 per month. A perpetual license to run the software on Windows Server or Linux starts at $995. There is a Free edition available in both deployment options, which is limited to one user, managing five workspaces.
Assess either format of Analytics Plus with a 30-day free trial.
EDITOR'S CHOICE
ManageEngine Analytics Plus is our top pick for an AIOps platform because many departments will want to use this tool. Regular data pool updates mean that analysis can be performed on near-live data. It can provide assessments of existing activities for operations performance, delivery quality, user behavior, security events, and financial information. AI features provide projections to ensure that development projects and ongoing operations are sticking to budgets or are likely to go over that limit. Capacity analysis helps you save money by avoiding over-provision of resources and keeping ahead of demand where trends indicate more resources will be required.
Download: Get 30-day FREE TRIAL!
Official Site: https://www.manageengine.com/analytics-plus/
OS: SaaS, Windows Server, and Linux
2. ManageEngine OpManager Plus – FREE TRIAL
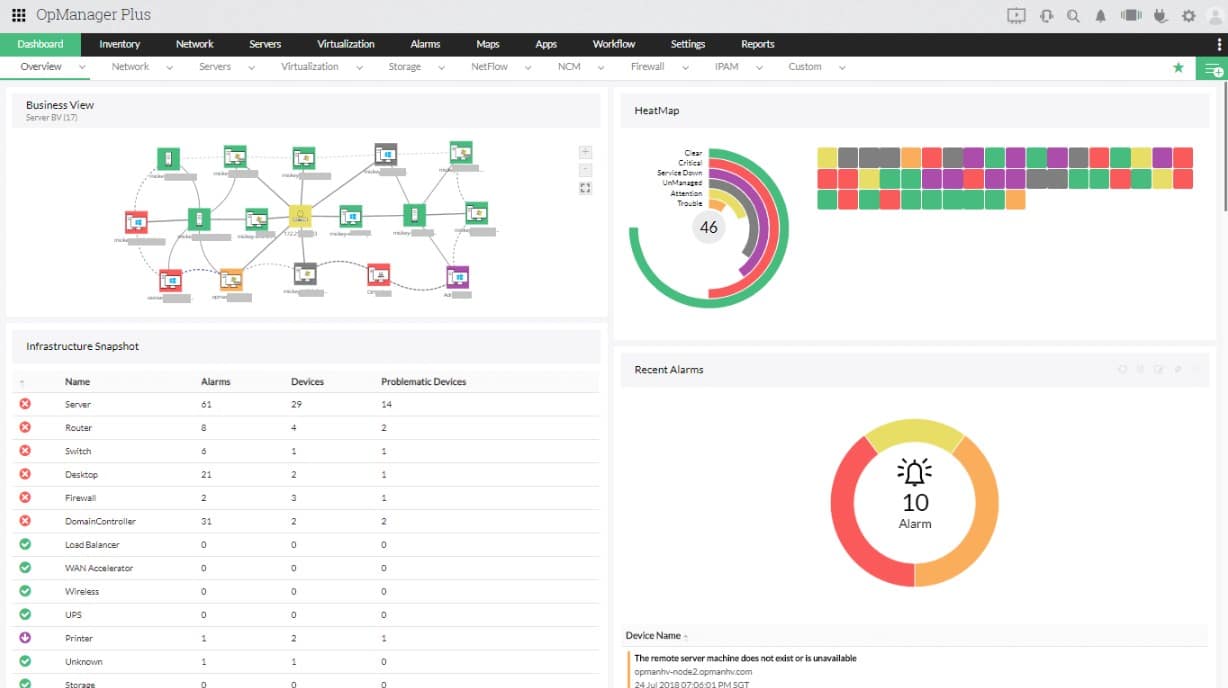
ManageEngine OpManager Plus is a bundle of ManageEngine network and server monitoring and management tools. Each unit in the package is also available individually. The pack provides all of the tools that an IT department needs to manage a system. All of the units in the bundle provide automated performance alerts and the thresholds for those alerts are continuously adjusted automatically by machine learning – an AI discipline.
Key Features
- Network monitoring and device management
- Server and storage device monitoring
- Application monitoring for hosted software
- Correlation between activities and problems for networks, servers, and applications
This is a full-stack monitoring package for on-premises systems. The correlation between units enables operators to see immediately the root cause of any emerging performance problem. Automated discovery features in the package include discovery and mapping for networks, virtualizations, and applications. This lets you track from user-facing software to supporting services, server resources, and network delivery systems.
Pros:
- Network device and traffic monitoring
- Network management features include IP address management and device configuration controls
- Security features include firewall management and network segmentation coordination
- Server performance monitoring watches the availability and capacity of CPU, memory, disk space, and network interfaces
- Application monitoring tracks the dependencies between software, services, infrastructure, and server resources
Cons:
- Doesn’t cover cloud platforms
You can start with a 30-day free trial download
3. Site24x7
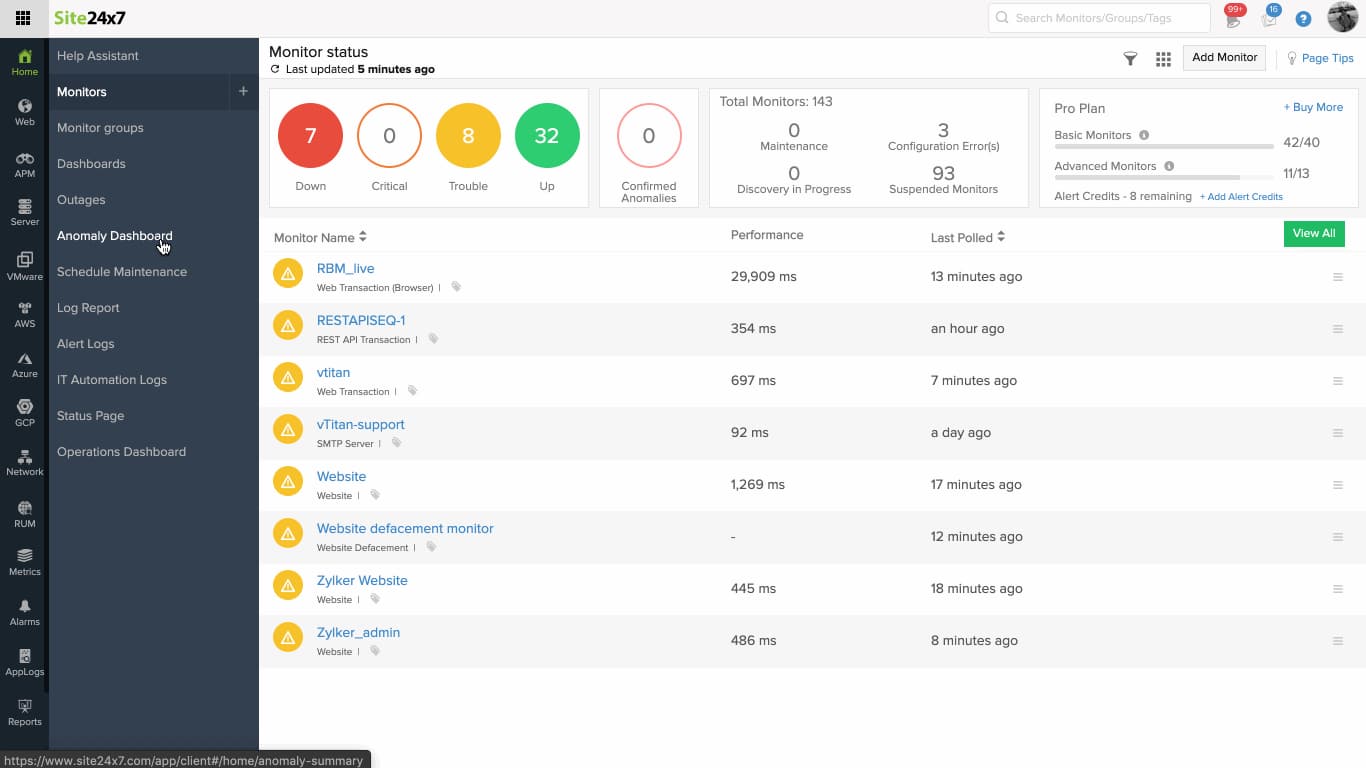
In the arena of AIOps Platforms, Site24x7 presents itself as a formidable contender, perfectly aligning with the needs of modern IT environments that demand intelligent, automated operations. This platform leverages artificial intelligence to enhance IT operations, making it capable of predictive analysis, anomaly detection, and automated remediation.
Key Features
- Advanced AI-driven analytics for IT operations
- Proactive problem resolution with predictive analysis
- Anomaly detection and automated remediation
- Integration with various IT management tools
- Intuitive user interface for easy operation
Why do we recommend it?
We recommend Site24x7 for its advanced AI capabilities that significantly enhance IT operational efficiency. Its ability to predict, detect, and automatically resolve issues makes it a valuable asset for any IT team aiming for high operational excellence.
Site24x7’s strength lies in its ability to process large volumes of IT operational data, offering insights that help in proactive problem resolution and optimizing IT performance. Its intuitive interface and integration capabilities with various IT tools make it an essential asset for businesses looking to harness the power of AI in their IT operations.
Who is it recommended for?
Site24x7 is ideally suited for IT managers, system administrators, and DevOps teams who require a sophisticated, AI-driven platform to manage complex IT environments. It’s especially beneficial for those seeking to automate their IT operations and gain predictive insights into their systems.
Pros:
- Employs advanced AI for predictive analysis and automation
- Seamless integration with various IT tools
- Intuitive interface simplifying complex operations
Cons:
- The depth of AI features might require a steeper learning curve for some users
4. Datadog
Datadog is an advanced cloud-based infrastructure management and monitoring platform. It provides APM, log management, security, network, synthetic, and real-user monitoring. Datadog is fantastic for collecting and aggregating data (such as metrics, traces, or logs) from more than 400 different technologies, using lightweight agents.
Key Features
- Build automated AIOps workflows with Datadog’s Webhooks integration and monitoring APIs
- Use built-in ML to simplify the management and monitoring of growing environments
- Analyze application performance for users
- Receive alerts and notifications via email, PagerDuty, Slack, etc.
With Datadog, you can keep track of a wide number of different resources, from network devices, containers, databases, servers, apps, cloud resources, and more. It can integrate with more than 250 built-in tools and services.
Pros:
- Offers numerous AIOps integrations
- Can monitor both internally and externally giving network admins a holistic view of network performance and accessibility
- Provides real-time feedback and root cause analysis tools
- Features an excellent easy to use interface
- Allows businesses to scale their monitoring efforts reliably through flexible pricing options
Cons:
- Would like to see a longer trial period for testing
Datadog offers different plans (Infrastructure, APM, Log management, and more.) For more pricing information, check Datadog’s website. Get a free trial of Datadog for 14 days.
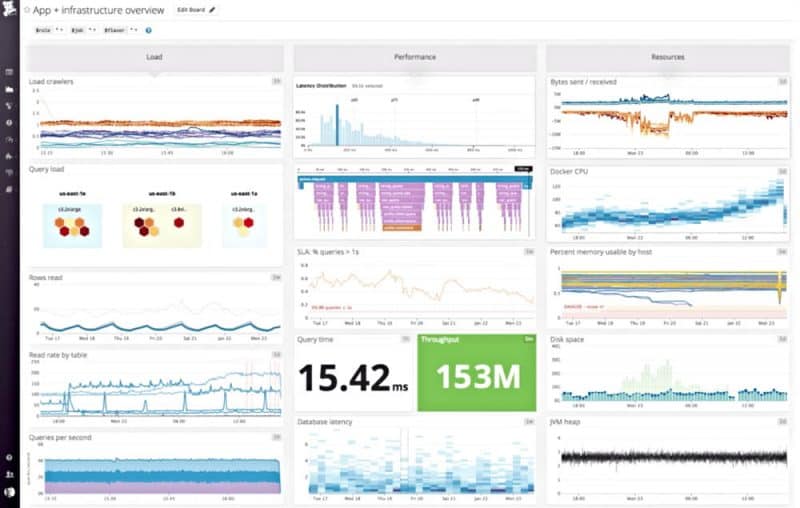
5. Dynatrace
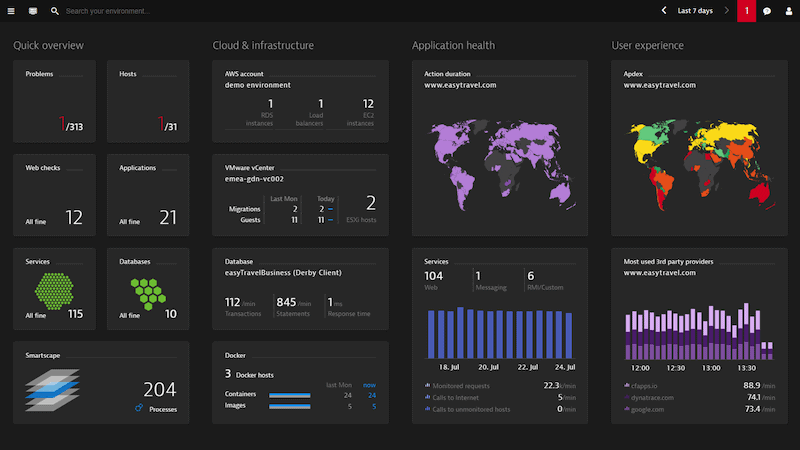
Dynatrace is an all-in-one intelligent application performance monitoring platform. It provides infrastructure and cloud monitoring, APM, digital experience monitoring, and automation. Dynatrace gives you AI-backed solutions for your entire IT ecosystem.
Key Features
- AI-empowered applications and microservices monitoring
- Monitor infrastructure, including servers, networks, containers, VMs, and logs
- AI-powered digital business analytics
- Digital Experience Monitoring (DEM) and Real User Monitoring (RUM)
- Cloud Automation enables quick auto-remediation and intelligent cloud orchestration
Dynatrace uses Davis (an AI causation engine) and automation capabilities to provide answers about the performance of applications, underlying infrastructure, and the end-users “digital” experience. The platform provides insights and the “recommended” actions for follow-up.
Pros:
- Leverages the latest AI technology to help AlOps teams gain insights faster
- Highly visual and customizable dashboards, excellent for enterprise NOCs
- Operates in the cloud, allowing it to be platform-independent
- Can monitor application uptime as well as the supporting infrastructure and user experience
Cons:
- Designed specifically for large networks, smaller organizations may find the product overwhelming
For more pricing information, get a quote. Register for a 15-day free trial of Dynatrace.
6. Cisco AppDynamics
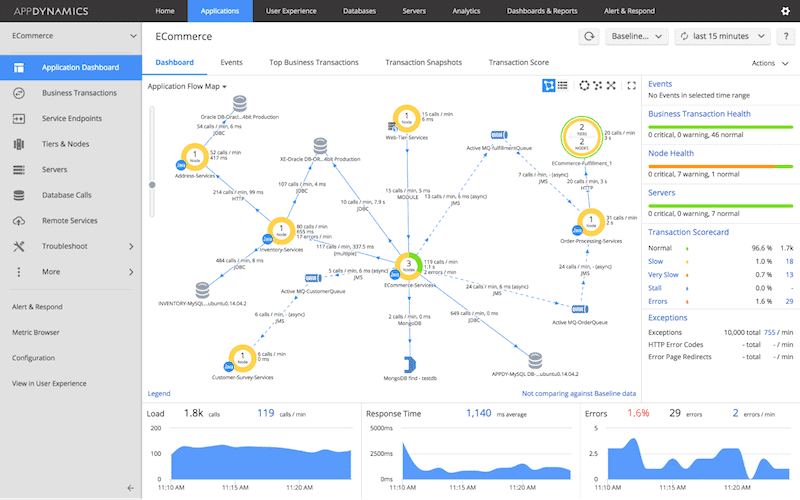
Cisco AppDynamics is an APM and IT operations analytics solution for cloud-based and on-premise environments. AppDynamics has been named for the 9th time (including 2021), a leader in the Magic Quadrant for APMs.
Key Features
- AppDynamics Business IQ for business performance monitoring
- Visualize digital experience. End-to-end user monitoring and insights
- Advanced APM to identify root causes of applications in real-time
- Visualize and optimize cloud, on-premise, or hybrid infrastructure
- Detect application code and security vulnerabilities
AppDynamics provides full-stack observability, including business health, user experience, application performance, infrastructure, network, and security— all in one unified dashboard. This platform is one of the few products that allows you to correlate full-stack performance data with key business metrics such as conversions.
Pros:
- Tailored for large-scale enterprise use
- Excellent dependency mapping and visualizations to help troubleshoot complex application systems
- Includes a free version
Cons:
- Would like to see more templates for monitoring
Four editions are available (Infrastructure Monitoring, Premium, Enterprise, and Real-user Monitoring). The price starts at $6/month per CPU Core. Get a free AppDynamics 15-day SaaS trial.
7. Splunk Enterprise
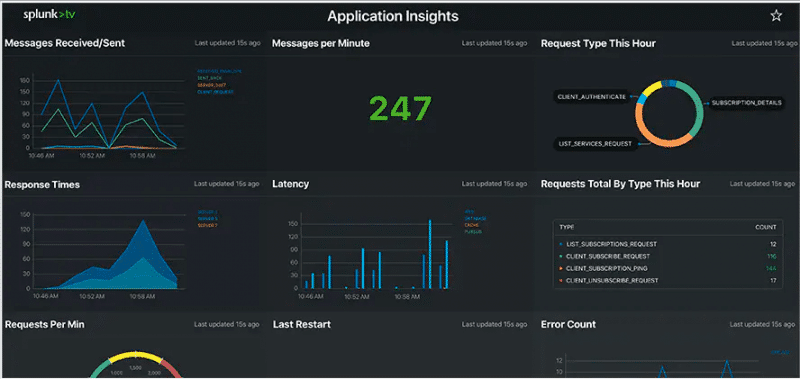
Splunk Enterprise is a machine data platform designed for data access, end-to-end service monitoring, powerful analytics, and automation. It provides full-stack visibility across cloud, on-premises, and hybrid infrastructure.
Key Features
- Visualized metrics
- Real-time or historical alerting
- Dashboards including fields, charts, boxes, etc.
- Reports of searches, tables, charts, or data visualization
Splunk lets you define data sources (websites, applications, sensors, etc), to automatically collect data from. Then, it lets you search, analyze, and visualize this data. Then, it indexes the stream of data and parses it with events data, to let you view and search, or get alerts. Additionally, Splunk provides data insights regardless of its source and format, and predictive and proactive insights (via AI/ML) to improve business decisions.
Pros:
- Can utilize behavior analysis to detect threats that aren’t discovered through logs
- Great user interface, highly visual with easy customization options
- Easy prioritization of events
- Enterprise focused
- Available for Linux and Windows
Cons:
- Must contact sales for pricing
- More suited for large enterprises
Based on infrastructure and workloads. The pricing tiers are unlimited and predictive. Download a 60-day free trial of Splunk Enterprise.
8. PagerDuty
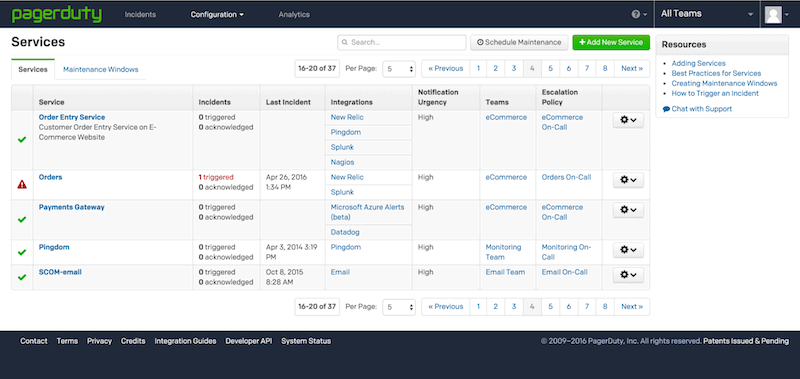
PagerDuty is a SaaS-based incident response platform designed to collect data, analyze it, and alert on outages and failures using ML and automation. It comes with built-in ML capabilities that help you configure rules based on AI and event intelligence.
Key Features
- On-call management scheduling and automatic escalations
- Use automation to identify data relationships and the problem’s root cause
- Provide full event visibility for central and decentralized teams
- Provide automation on issue resolutions
- See the insights and trends of your teams and services via Intelligent Dashboards
Additionally, the platform comes with a powerful alerting system. It can alert you of incidents via email, push, SMS, or phone. You can also set PagerDuty to automatically group alerts into single incidents using ML algorithms (enhanced by humans).
Pros:
- Combination of communication and incident response platform
- Ideal for small to medium-sized teams
- Leverages AI to improve alerting functions
- Is offered as a flexible SaaS product
Cons:
- Enterprises might be left wanting more
- No self-hosted version is available
Four editions are available: Free ($0 up to 5 users/month), Professional ($19/user/month), Business ($39/user/month), and Digital Operations (Contact). Get a PagerDuty 14-day free trial.
9. LogicMonitor
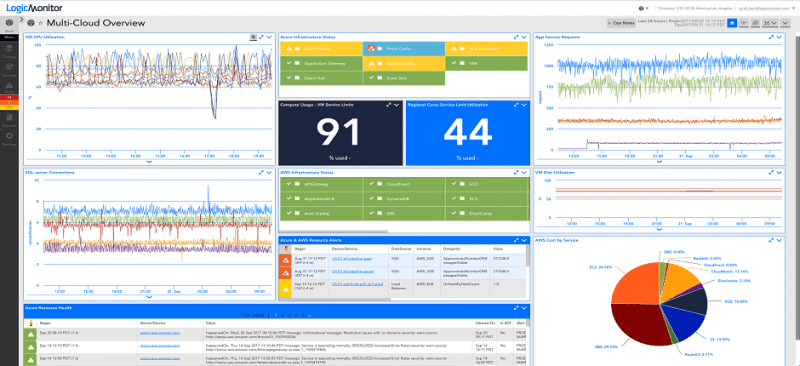
LogicMonitor is a SaaS-based APM and network monitoring solution. It comes with +1000 pre-built automation monitoring and alerting mechanisms to help you keep track of applications and underlying infrastructure. It lets you monitor cloud, on-premises, and hybrid environments.
Key Features
- AIOps Early Warning System
- Dynamic thresholds that use anomaly detection algorithms
- Identify and analyze root cause
- Forecast and trend prediction for the monitored infrastructure
- Flexible alerting and real-time dashboards
LogicMonitor provides an AIOps platform powered by LM intelligence with AI and ML capabilities. LM Intelligence will analyze performance data and alerts, provide context, and early alerts, find patterns and anomalies, forecast, and enable automation. For example, if LM detects abnormal behavior it can automatically execute a custom script.
Pros:
- Monitors application performance via the cloud
- Can monitor assets in hybrid cloud environments
- The dashboard can be customized and saved, great for different NOC teams or individual users
Cons:
- The trial is only 14 days, would like to see a longer testing period
LogicMonitor is available in two editions, Pro and Enterprise. For more information request a quote. Sign up for a free 14-day trial of LogicMonitor.
10. Instana Enterprise Observability
IBM Instana is an enterprise observability and application performance monitoring platform. Instana is specially designed for managing microservices and cloud-native applications.
Key Features
- Automated discovery, monitoring, root cause analysis, and feedback
- Optimize performance and availability with Instana’s Dynamic Graph, Context Guide, and Unbounded Analytics
- Proactive delivery of actionable intelligence
The Instana Enterprise Observability platform automatically collects performance data (metrics, logs, events, and dependencies), from the cloud, on-premise, microservices, containers, or hybrid environments. It provides AI-based root cause analysis and high cardinality analytics. Instana processes data and turns it into contextual and actionable data, “automation”.
Pros:
- Ideal for monitoring microservices and cloud apps
- Designed with enterprise teams and operations in mind
- Offers a wide variety of integrations and support
Cons:
- Better suited for enterprise companies that rely on cloud services
Instana pricing starts at $75 per host/per month/billed annually. Sign up for an Instana 14-day free trial.
11. Big Panda
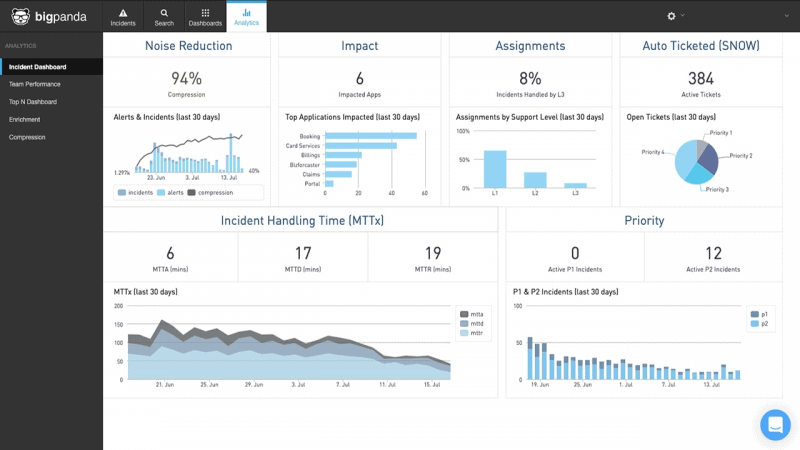
Big Panda is an advanced event correlation and automation platform powered by AIOps. It collects observability and monitoring data from tools and technologies, change data from change management, and topology data from sources such as orchestration. Big Panda integrates all this data into a single Open Hub.
Key Features
- Advanced event correlation
- Root cause analysis
- Automate incident response
Big Panda’s Open Box Machine Learning ingests aggregated alerts and event (monitoring) data and correlates it with topology data using ML heuristics. Additionally, Big Panda performs a root-cause analysis using change information, plus other processed data to identify anomalies. As a result, the platform can provide actionable insights and automation capabilities.
Pros:
- Leverages AI to collect, interpret, and manage a variety of data points
- Uses automation to streamline workflows and improve team intelligence
- Clean and highly intuitive UI
Cons:
- Would like to see a trial versus a demo
Register for a free demo.
12. MicroFocus OpsBridge
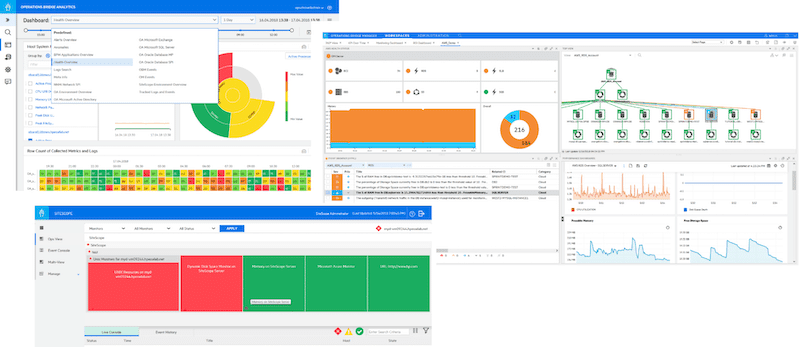
OpsBridge by MicroFocus is an automated event correlation, analysis, and performance monitoring platform powered by AIOps. It is designed for a wide range of environments, from multi-cloud, SaaS, on-premises, and hybrid IT.
Key Features
- Topology-based event correlation
- Anomaly detection
- Root causes visualization
- Service-driven analysis
- Remediation automation
- ChatOps support
OpsBridge can collect and integrate monitoring (metrics, logs, events) data from more than 200 different technologies and tools. It discovers the topology to provide monitoring capabilities and event correlation to find the root cause of problems. Big Panda centralizes the data in a single-pane-of-glass and provides ML and AIOps-based big data analytics.
Pros:
- Excellent dashboard and monitoring interface
- Leverages over 200 different tools for data collection
- Offers a single pane view into all your AIOps operations
- Offers root cause analysis for teams
Cons:
- Better suited for larger teams and enterprises
Download a free trial of Operations Bridge Manager (OBM), a core component of the Operations Bridge. OBM can automatically discover and correlate data.
13. Moogsoft
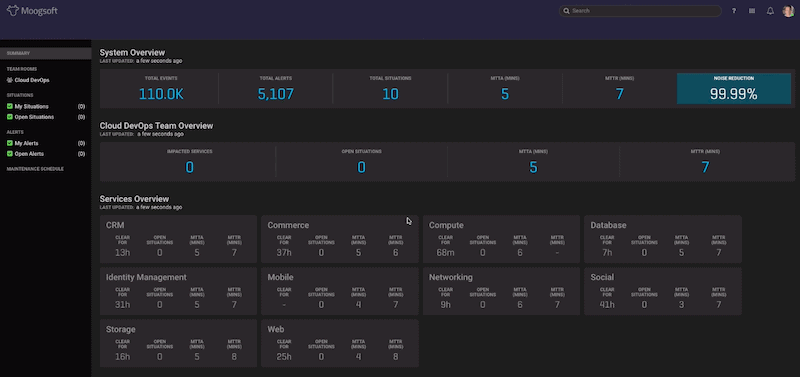
Moogsoft is an enterprise cloud-native AIOps and observability platform. It provides noise reduction, data enrichment, correlation, and anomaly detection. It delivers actionable service insights and alerts in real time.
Key Features
- Real-time analysis and Machine Learning
- Early incident and anomaly detection and remediation
- Customize and out-of-the-box integrations
- Cross-domain collaboration
Moongsoft takes metrics, events, and alert data, and automatically applies noise-reduction algorithms. It also provides methods (deduplication) for bringing context to data interdependencies. Cleaning and enriching data helps faster incident detection and resolution. Moogsoft also correlates data to identify patterns in apps and systems and ensure they are running at their highest performance.
Pros:
- Sleek and simple admin console
- Built for enterprise AIOps
- Uses noise reduction AI to reduce alert fatigue and duplicate alerts
- Offers real-time analysis – even at scale
- Supports a free version
Cons:
- Can take time to fully explore all the platforms features
Three editions are available. Free ($0), Team ($833/month), and Enterprise (contact). Request a free Team Moogsoft Trial express.
14. Zenoss Cloud
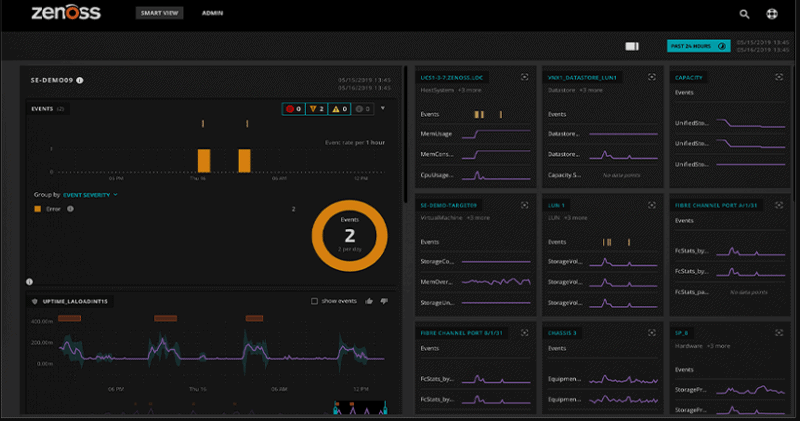
Zenoss Cloud is a SaaS-based intelligent application, service monitoring, and AIOps solution. It can provide full-stack monitoring capabilities for a wide range of IT environments, cloud, on-premise, hybrid, to dynamic multi-clouds.
Key Features
- Full-stack monitoring and automation
- Root-cause analysis using Machine Learning
- Use real-time models to understand data dependencies
- Real-time alerts and proactive solutions
- Monitor multi-vendor products from a single-pane-of-glass
The Zenoss Intelligent IT Operations Management Platform can collect and analyze data, including metrics (push/pull), events, logs, dependency data, and streaming data, across different IT environments. Zenoss streams and normalizes all machine-generated data, using dynamic ML-based analytics in real-time.
Pros:
- Open-source, completely free tool with two paid options
- Uses network discovery to automatically pull in new devices that enter the network
- Can support multi-site networks encompassing both LAN and WAN
- A wide range of Cisco ACI plugins offered by the Zenoss community
Cons:
- Support is only for paid tiers
Zenoss Community Edition is a free and open-source application. The Zenoss Cloud is available in two commercial editions: Professional and Enterprise. For more information request a quote. Register to try Zenoss Cloud for free.
15. New Relic One
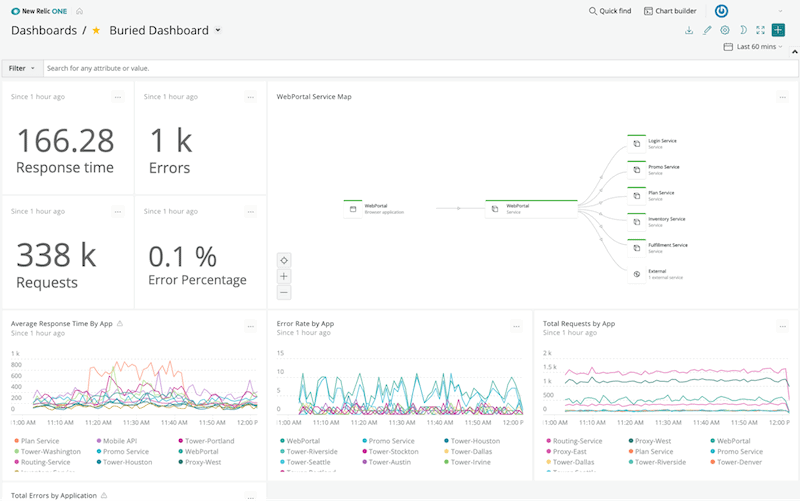
New Relic One is an advanced cloud-based observability platform. It allows full-stack observability for easy visualization, troubleshooting, and optimization of your entire software stack from a single place. It can help you keep track of your distributed services or applications regardless of where they are deployed.
Key Features
- Instant anomaly detection
- Automatic correlation of events and alerts
- ML-based automatic root cause analysis
- Integration with incident management
New Relic One also comes with a Telemetry Data Platform that provides a connected, real-time, and centralized view of all your operational data. This platform provides analysis and alerts on all metrics, events, logs, traces, etc. The New Relic One software also uses “Applied Intelligence” to help detect issues faster and understand what caused the issue and why.
Pros:
- Certified for Microsoft Azure monitoring
- Uses anomaly detection to highlight abnormal behavior in your Azure environment
- Uses simple but intuitive admin dashboards
Cons:
- Better suited for small to medium-sized Azure networks
Telemetry Data Platform ($0.25 per GB ingested beyond the free limit). Full-Stack Observability: Standard (One full-access user free- $99 per additional user/month), Pro, and Enterprise. For more details, check pricing. Sign up for New Relic to get a fully functional free trial.
Conclusion
All the AIOps platforms shown in this post use AI or Machine Learning to analyze large volumes of data. They can monitor (some provide observability) and analyze data collected from different types of systems and infrastructures. These platforms can also help identify (proactively or reactively) issues and even help in the resolution process.
Fortunately, all of the above AIOps platforms are quite comprehensive, easy to learn, and all provide a free trial. To get yourself started, try platforms like ManageEngine Analytics Plus, Datadog, Dynatrace, or Cisco AppDynamics.
AIOps Platforms FAQs
What is an AIOps platform?
An AIOps (Artificial Intelligence for IT Operations) platform is a technology platform that combines artificial intelligence, machine learning, and big data analytics to automate and optimize IT operations processes and workflows.
What are the benefits of using an AIOps platform?
The benefits of using an AIOps platform include improved IT operational efficiency, faster incident resolution, reduced downtime, enhanced security, and improved customer satisfaction.
What are the features of an AIOps platform?
The features of an AIOps platform include data ingestion, data analysis, anomaly detection, root cause analysis, event correlation, alerting and notifications, automation, and collaboration.
What are the types of data sources that an AIOps platform can ingest?
An AIOps platform can ingest data from a variety of sources, including log files, metrics, traces, configuration data, and user data.
What is event correlation in an AIOps platform?
Event correlation is the process of analyzing and connecting events from different sources to identify patterns and relationships. An AIOps platform can use machine learning and big data analytics to correlate events and provide contextual information to IT teams.

