
Our funding comes from our readers, and we may earn a commission if you make a purchase through the links on our website.
Application Monitoring – Best Practices
UPDATED: December 21, 2023
To keep clients and ensure your business remains productive, your network must maintain consistent performance. Since your end users often engage directly with your application infrastructure, problems such as brownouts and overall performance degradation are particularly relevant to it. Poor application performance frequently goes unnoticed unless you properly integrate an application monitoring tool that can analyze your data traffic from a software level, and make rigorous observations into your live code.
But how should you approach application monitoring?
This article discusses some of the best practices that you should bear in mind when setting up an application monitoring suite. Make sure to read through these helpful tips thoroughly, and employ the tactics in your application monitoring. We’ve also included several application monitoring tool recommendations that can help you know exactly which is the right tool for your business demands.
Use Automation
By digging into the data at a more accurate and human-readable level, it allows you to use the data that is being presented in more substantial ways. More often than not, this data is going to be used in other responsive systems, and this is where automation comes into play. By understanding the trends in play within your systems, you can schedule automated responses to spikes and dips in the data.
This is typically done by feeding the data into other systems through integrations, but several APM or ASM tools come with inbuilt automation options available. Automated alerting is probably the most common form of automation you’ll rely upon, but we discuss that in more detail later. Another typical setup is automated load balancing, which can drastically improve application performance by responding to load demands on your infrastructure faster than a human notification.
Automated ASM (Application Security Monitoring) can also be used to increase security. By setting up automated detection systems that flag anomalous usage data, you can script responses like blocking IP or account access. While it typically falls under network monitoring instead of application monitoring, you can also set thresholds to counteract DDoS attacks, just to add an extra layer of prevention to your network infrastructure.
Ultimately, it’s the job of automation to perform actions that are either too immediate or too bothersome for your colleagues to have to perform. It’s up to you and your team to determine exactly what that might mean for your business.
Maintain your Monitor
Whatever tool you choose to employ, ensure that it is rigorously tested within your environment—which is where demos and free trial periods can shine as opportunities to test the features that are available within the available various tools. This helps prevent faults further down the line.
Because you’re using this tool to monitor the performance and security of your applications, it is wise not to try to build your application monitor, and instead rely on market-tested products. Otherwise, you’re simply creating more avenues for errors as the tool you create may even be less stable than the applications it is designed to monitor—the only way you’d know for sure is to monitor the monitoring software—which is ridiculous. Instead, go with products that are on the market and designed with APM first and foremost.
Depending on the automation processes you have in place, you will also undoubtedly have to maintain and adjust them as circumstances shift. Elements of your application may stop responding to the monitor as either it or the monitor is updated or changed; it is a good idea to keep testing your automation systems to ensure they’re still producing accurate responses.
Monitor the Right Metrics
Because applications are frequently monitored as a portion of the wider network infrastructure rather than separately, poor application performance frequently goes unnoticed. This indicates that the data being tracked doesn't always provide a complete picture—so it’s important to track the correct metrics using a properly outfitted application monitoring tool.
The most important data to pay attention to when monitoring your application are:
- Average Response Time
- Error Rates
- Request Rate
- Application and Server CPU
- Application and Server Memory
You might also want to prioritize monitoring Garbage Collection as part of your APM because some app languages, like Java, employ it as well—Garbage Collection is the process of clearing up memory use in your applications. Another crucial performance indicator that is specific to application performance monitoring is Apdex. It is a score in decimal form between 0 and 1, and it represents an overall representation of how well your services are accessed by your end users as a whole.
Alerting & Reporting
Setting up an elaborate system to monitor your numerous applications is pointless if the data that you are keeping track of goes unnoticed. Once you have set up all of the necessary automation and are tracking the correct metrics, you should also set up proper alerting. Almost all professional application monitoring tools come with highly customizable altering options that can detect anomalous or unhealthy spikes in your data—use these liberally.
It’s also vital to make sure these alerts are going somewhere that they’re going to be seen and acted upon quickly. Don’t be afraid to set the alerting for multiple destinations, like your Slack, email, and texts all in one alert. Making sure that the alerts are caught and handled will be the difference between outages and performance degradation that will cost your business substantial amounts of money and productivity.
On the other side of this methodology is reporting; namely scheduled reporting that you can use to consistently keep track of your performance and security data over longer periods. Reporting data can be plugged into any number of forecasting solutions to track trends in your application usage data, which can be especially useful when considering an upgrade.
Reporting is also useful because it can be used to present otherwise tech-heavy data in a more readable and non-technical way, which is useful when showing the data to your colleagues in other departments. Reporting data might also be necessary for certain compliance requirements, especially regarding user data security.
Communicate with your Vendor
A simple but crucial tip that goes for basically any big product that you’re adding to your network infrastructure: establish a line of communication with your vendor. This is useful across the board, but particularly for application monitors because of the sheer number of integrations and unique data sets, you’ll need to track.
This is the kind of thing that the vendor will be able to support you with, especially if you’re using their API to integrate your bespoke product requirements into their monitoring tool. They’ll be able to provide the right documentation, and even help out with some of the code required to get you properly set up and integrated—remember, they want you on their platform, so they’re going to be more than willing to help you stay.
Pick the Right Tool
In the same way network monitoring tools give correct data on your hardware, application monitoring solutions fulfill the requirements for accurate APM and ASM. There is a lot of overlap between these kinds of tools, and some of the top network monitors available today also deal with application monitoring, either as a part of their main offering or as a supplementary service that can be added to your network.
There are a few important factors to consider if you're unsure what to look for in an application monitoring tool. The ability of the solution to manage your applications is one of the most crucial alternatives; if it can't, it's probably not the right one for you. These software-level integration tools work with your apps to analyze the infrastructure at the code level while utilizing plugins and logging metrics. Since you need to make sure that all of your applications are compatible with the tool you're using, the availability of integrations is frequently the deciding factor when selecting an application monitoring solution.
Our methodology for selecting application monitoring tools and software
We reviewed the application monitoring market and analyzed the options based on the following criteria:
- Out-of-the-box features, templates, and reports
- The ability to collect an application’s real-time status
- A facility to analyze performance and uptime over time
- Graphical interpretation of data, such as charts and graphs
- A free trial period, a demo, or a money-back guarantee for no-risk assessment
- A good price that reflects value for money when compared to the functions offered
We have three top picks from the best application monitoring tools on the market for you to choose from, and all three of the solutions we've provided here come with fully documented APIs. Each of these products offers highly integratable, scalable solutions ideal for your monitoring needs. Make sure to read through our thorough reviews of each of the products listed below to decide which is the best choice for you.
1. SolarWinds AppOptics – FREE TRIAL
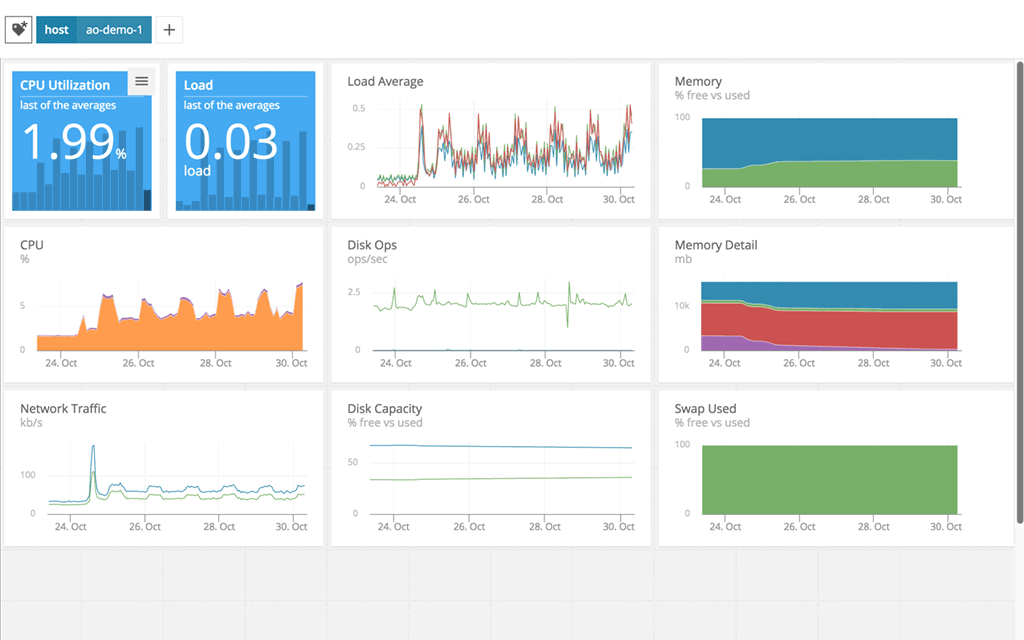
One continuous application monitoring solution with many integration plugins for different health and performance services is Solarwinds AppOptics. The solution can offer comprehensive data on your faults and server downtime to aid in more efficient application troubleshooting. Solarwinds also offers several pre-configured dashboards to speed up setup processes and offer real-time data monitoring.
Key Features
- Integration plugins
- Wide variety of monitoring metrics
- Full-stack app monitoring
- Customizable or Pre-set dashboards
- Solarwinds products integration
Continually monitor hosts, containers, and your serverless environments. You can spot issues as soon as they occur by using the systems offered by the product, which will also help you keep the MTTR to a minimum. Analyze your live code to see exactly what isn't functioning properly, and troubleshoot with AppOptics APM's features like distributed tracing, live code profiling, and exception tracking.
You may easily compare business, external systems, IoT, and just about any other data source to infrastructure and application metrics using the accessible API. The AppOptics framework makes it simple to develop and locate distinctive metrics.
Pros:
- Offers great visualizations reflecting live and historical health metrics and resource consumption
- Is an easily scalable cloud service
- Tracks all major resources focusing on over 180 different metrics
- Can monitor Docker, Azure, and Hyper-V platforms, offering more flexibility than competing options
Cons:
- Would like to see a longer trial period
Price: The website offers a thorough 30-day free trial of Solarwinds AppOpticts. Solarwinds offers “packs” of the AppOptics system that contain 10 hosts and 100 containers, with Infrastructure Monitoring and Application Monitoring available for purchase separately. The cost of the Infrastructure Monitoring solution is around $10 per host per month in addition to the $25 monthly fee for the Application Monitoring package.
Download: https://www.appoptics.com/
2. Site24x7 – FREE TRIAL
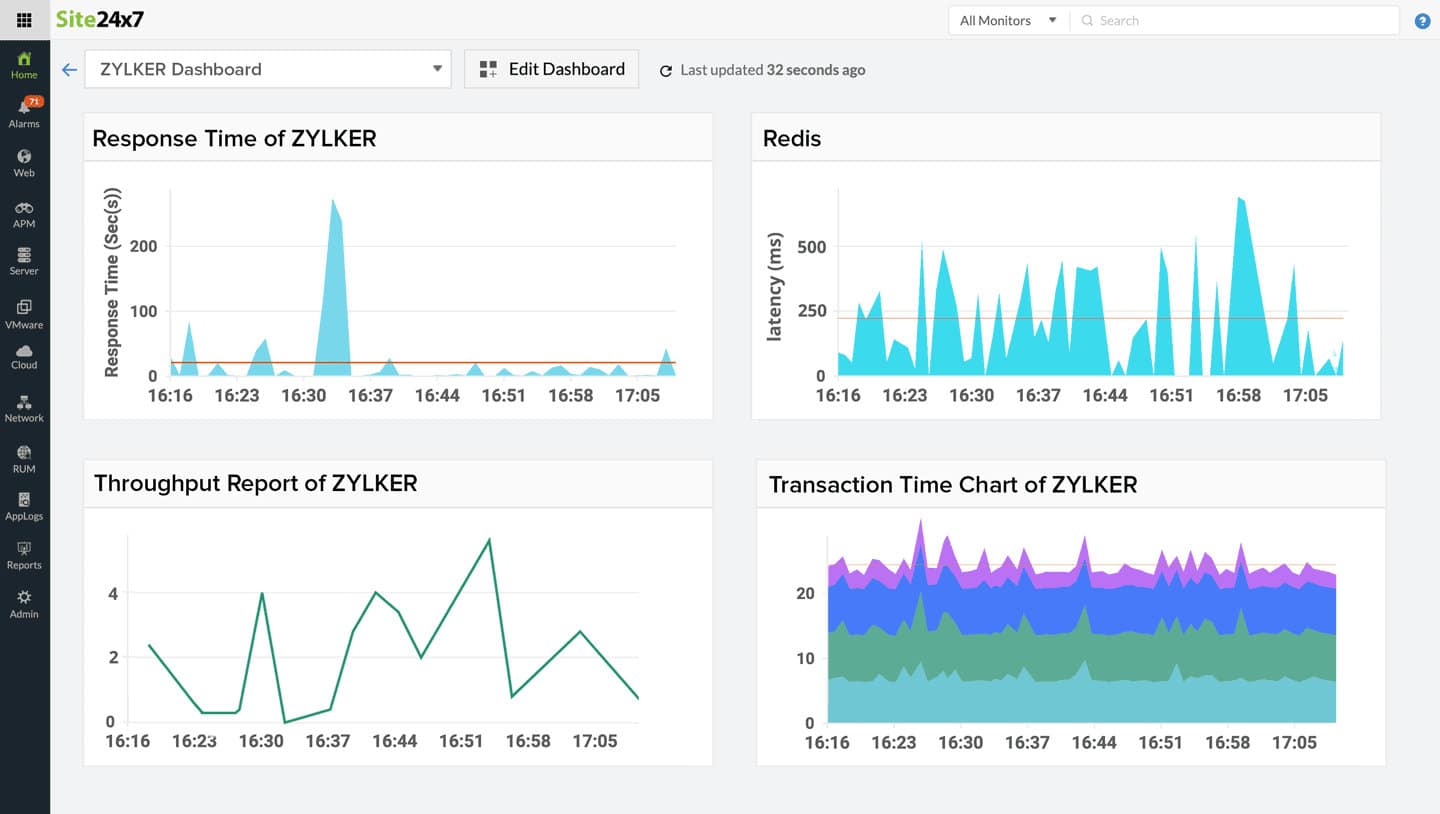
When it comes to Application Monitoring, Site24x7 stands as an exemplary tool, offering robust features that fit well within the context of ensuring optimal performance and availability of applications. This tool is designed to monitor the performance of applications in real-time, providing insights into various metrics such as user experience, application response times, and system resource utilization.
Key Features
- Real-time application performance monitoring
- Detailed insights into user experience and system resource utilization
- Proactive alert system for performance issues
- Supports a wide range of application environments
- Comprehensive reporting and analytics
Why do we recommend it?
Site24x7 is recommended for its comprehensive and detailed approach to application monitoring. It excels in providing real-time insights and alerts, which are essential for maintaining high application performance and availability.
Site24x7's ability to seamlessly integrate with a range of application environments makes it a versatile choice for monitoring both web and mobile applications. Additionally, its proactive alert system ensures that any performance degradation is promptly addressed, minimizing downtime.
Who is it recommended for?
This tool is particularly beneficial for application developers, IT operations teams, and DevOps professionals. Site24x7 caters to those who need in-depth monitoring of application performance, especially in complex and dynamic application environments.
Pros:
- Real-time monitoring and instant alerts
- Supports diverse application environments
- Comprehensive and detailed performance insights
Cons:
- May require a learning curve for optimizing all available features
3. Datadog APM
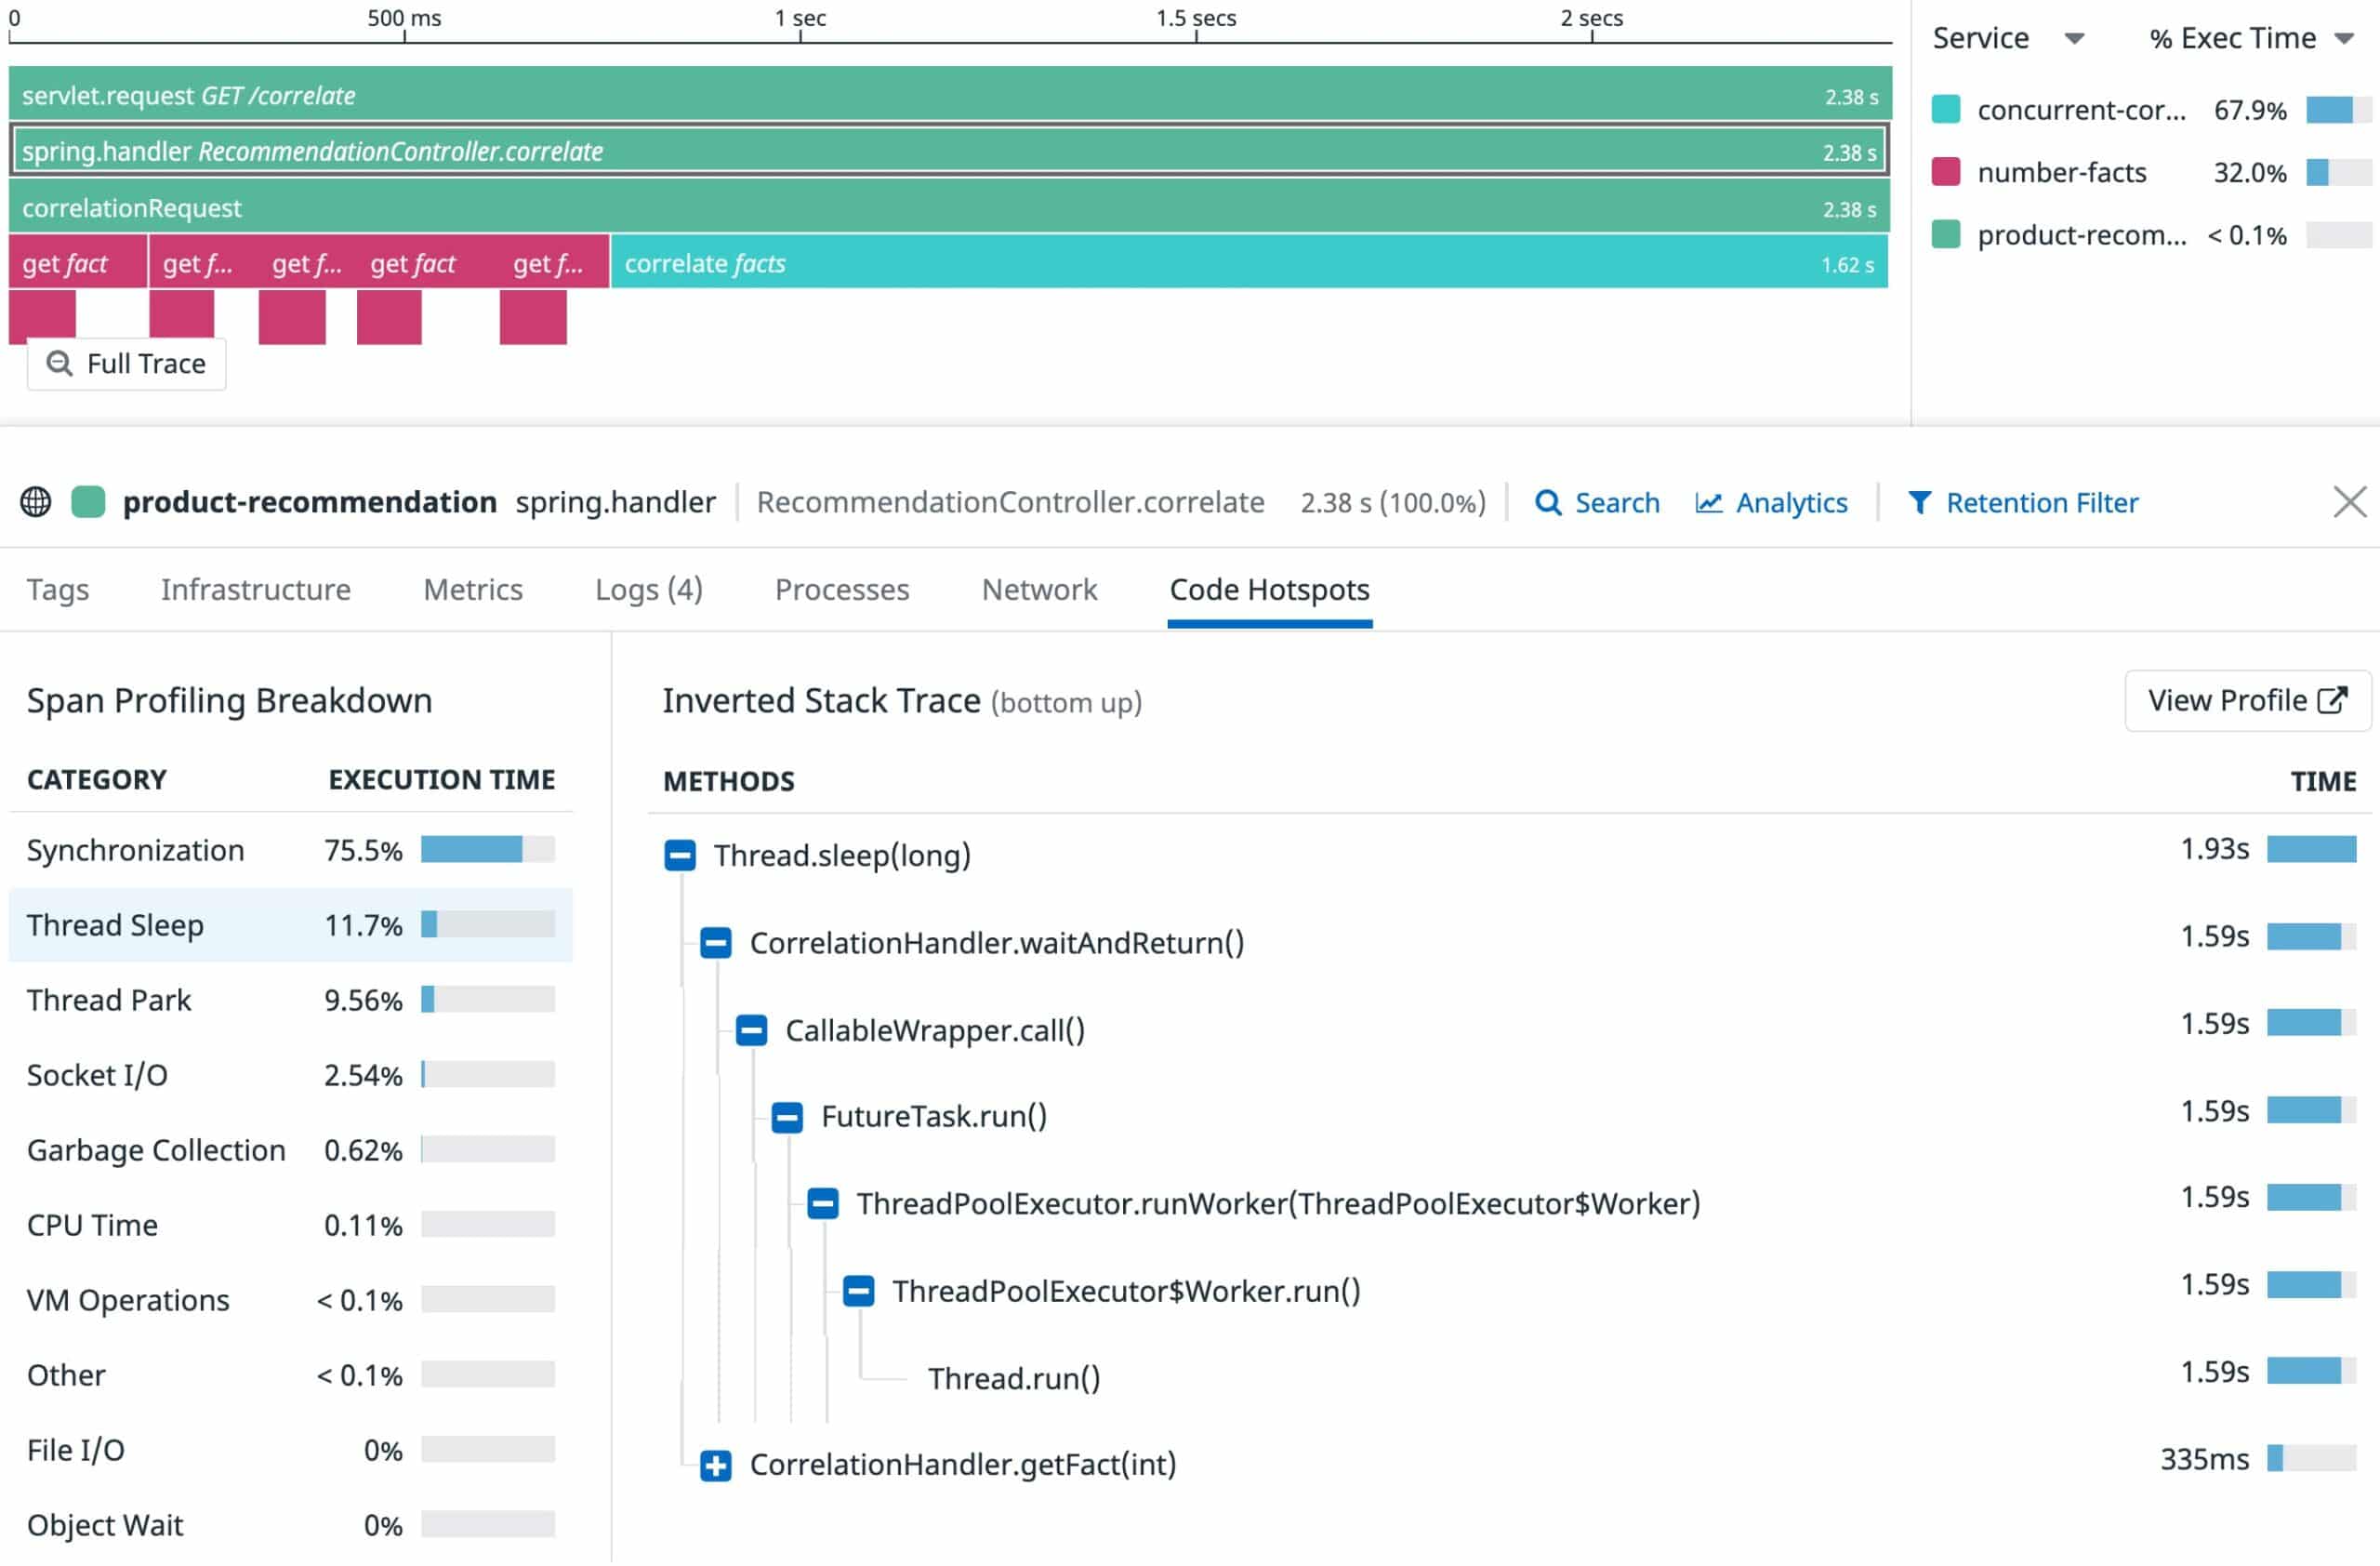
Datadog's installation agent comes with packages for many integrations, making it simple and quick to set up your apps for complete monitoring. By dividing sluggish requests by the amount of time spent in code on the CPU, GC, lock contention, and other factors, you may utilize always-on, low overhead code profiling to enhance your production code, lower computation costs, and minimize the reasons for delays.
Key Features
- Fast installation & integration
- Customizable dashboards
- Health and performance data correlations
- Down notifications
- Balancing with other integrations
Issues may be found more quickly and precisely with real-time insight into all ingested traces and service dependencies over the preceding 15 minutes. Additionally, you can monitor your front-end and back-end traffic data using the solution's fully configurable dashboards. To ensure you keep an eye on the health of your application servers, you can modify setup restrictions and warning mechanisms.
Pros:
- Offers numerous real user monitors via templates and widgets
- Can monitor both internally and externally giving network admins a holistic view of network performance and accessibility
- Changes made to the network are reflected in near real-time
- Allows businesses to scale their monitoring efforts reliably through flexible pricing options
Cons:
- Would like to see a longer trial period for testing
To test the app integration and evaluate how well it works with your infrastructure, Datadog offers a full 14-day free trial. Data forecasting, which enables you to make predictions, and AI-driven alerting, which may be useful depending on the size of your infrastructure and the demands placed on your application servers, can be added to the Pro version to enhance its capabilities.
4. ManageEngine Applications Manager
Application capacity data can be monitored and thorough performance metrics can be provided by ManageEngine Applications Manager. You may avoid outages and reduce problems with server performance and health in physical, virtual, and cloud settings by ensuring that your applications have adequate resources and by efficiently planning for capacity. The monitoring tool may also research front-end information, such as client connections, and examine normal user behavior.
Key Features
- Health metric aggregation
- Alarms for health risks
- Customizable dashboards
- Hotspot detection
- Smooth integration
Application performance issues with databases can be promptly identified and resolved; this involves evaluating SQL queries to watch for and identify delayed database calls. Agentless monitoring is possible for a wide range of databases, including RDBMS, NoSQL, in-memory, and massive data stores. By quickly identifying performance issues and bottlenecks in advance, well-known ERP solutions like SAP, Oracle EBS, Microsoft Dynamics CRM & AX, and Siebel CRM can also be made more accessible and perform generally better.
Pros:
- Offers on-premise and cloud deployment options, giving companies more choices for install
- Can highlight interdependencies between applications to map out how performance issues can impact business operations
- Offers log monitoring to track metrics like memory usage, disk IO, and cache status, providing a holistic view into your database health
- Can automatically detect databases, server hardware, and devices for real-time asset management
Cons:
- Can take time to fully explore all features and options available
ManageEngine Applications Manager, which supports up to 5 servers or apps under surveillance, is available for free download from the website. The Professional and Enterprise editions of the service also provide a free trial.
Application Monitoring Best Practices FAQs
What are some common metrics used in application monitoring?
Some common metrics used in application monitoring include response time, error rate, resource utilization (e.g. CPU, memory, disk), and throughput (e.g. requests per second).
How does application monitoring differ from system monitoring?
System monitoring focuses on monitoring the underlying infrastructure of an application, such as servers, networks, and storage. Application monitoring focuses on the performance and availability of the application itself, including its behavior, response time, and error rate.
What are some popular tools for application monitoring?
Some popular tools for application monitoring include Datadog, New Relic, AppDynamics, and Dynatrace.
What are some best practices for application monitoring?
Some best practices for application monitoring include regularly reviewing and updating monitoring configurations, using a combination of synthetic and real user monitoring, integrating monitoring data with logging and incident management systems, and regularly reviewing and acting on performance and availability data.

