
Our funding comes from our readers, and we may earn a commission if you make a purchase through the links on our website.
Appflow Collector & Analyzer for Monitoring Citrix & Other Supported Devices
UPDATED: January 20, 2020
Appflow is, at it's core, another facet of the overall amalgamation of NetFlow and all of it's variations and iterations.
Appflow, in a more specific sense, is a flow protocol found almost exclusively on Citrix and Sonicwall devices that takes a stab at improving NetFlow beyond most simple extensions.
One of Appflow's initial goals was to shoot for a fully open standard, allowing for widespread use.
It adds functionality to devices like the NetScaler that just isn't there with a more basic IPFIX or other NetFlow protocols by building on top of IPFIX to provide improved reporting for the needs of specific environments.
Specifically, new elements are added to the flow information being tracked, sent and added to the database, providing a stronger representation of available data points with which to perform preventative maintenance, troubleshooting, and repairs.
But speaking more to its technical capabilities and the importance of flow monitoring of any kind, Appflow included, there's not much that can be overstated.
Monitoring Router & Firewall device information, especially that which is specific to Citrix devices like NetScaler, is critical for environment stability and reliable functionality.
Generalized NetFlow monitoring is important, as any technician knows, but Appflow adds on several critical bits – web page performance data, database information, application-level information, and more are added via elements so as to improve monitoring usefulness.
The entire protocol uses and action/policy approach – actions choose collectors for information to be gathered and from in the records, and policies determine which records of those gathered will be actually recorded from the specified action. It acts as sort've a two-step filtering process to reduce overall overhead and performance impact while still allowing you to gather a wide range of information.
AppFlow Traffic Monitoring & Analysis
One particular application, Solarwinds' free Real-Time Appflow Analyzer, provides all the handy added Appflow collector data in a simple and, obviously, real-time format! Utilizing this program is quite simple and configuration is a breeze in most environments.
A handful of specific datapoints are crucial when carefully monitoring Appflow supported devices.
URL Latency monitoring makes sure that sites are performing as expected – latency is one of the most critical things, besides being simply up or down of course, when it comes to website performance.
Users notice latency more than anything else, and as any good technician knows the bottleneck for performance should always be the user whenever possible, never the system (as much as we can manage, of course!) Beyond simple latency, though, monitoring HTTP status codes is an excellent want to know what responses client machines are receiving.
If you're carefully monitoring a site and notice a sudden uptick in “500” range errors, you know something is amiss, and monitoring for this via Appflow is one of the best ways to know as soon as possible, especially when the outage isn't a complete server outage but instead possibly one in a cluster, a different datacenter, or other smaller failures or problems.
HTTP Codes help give you an idea of the health of the client-side experience more than just the server-side “is everything okay.”
Things can all be up and running fine, but without knowing about a ton of “300” range errors, you might not find out ab out a DNS issue until much later!
It's a simple thing to track that can be vitally important to know.
And, finally, it also reports on HTTP Request Methods, which may not be as critically important for overall performance and troubleshooting, but is still a very good metric to have.
A sudden burst of “HEAD” requests would suggest a sudden spike in search queries or other similar robotic traffic, for example.
Once launched you can simply choose from a list of available Appflow supported devices in the collapsible categories on the left side under the “Citrix Appflow” selection.
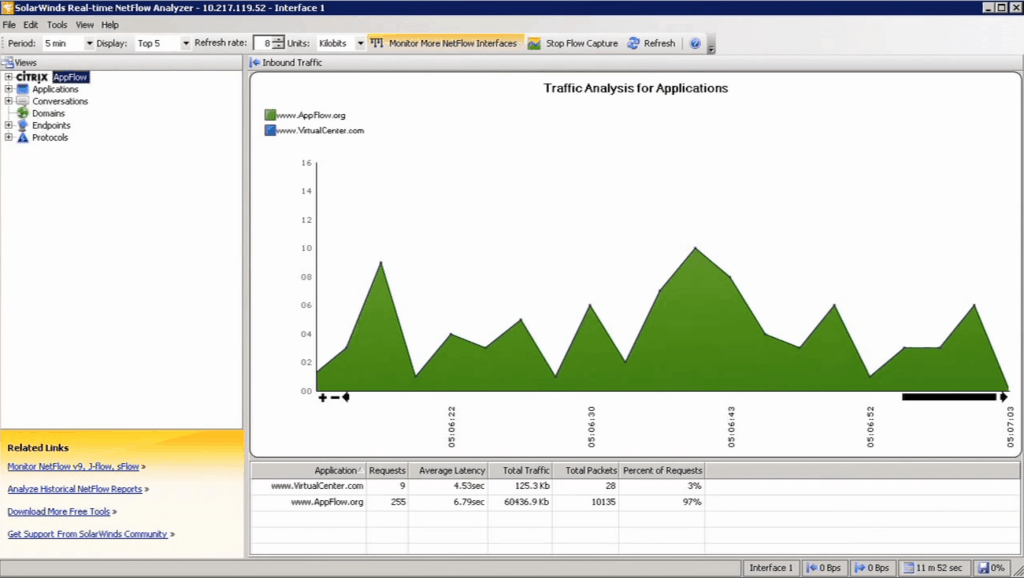
The main screen already shows an overview for supported devices and domains, as seen above.
Once expanded, selecting an actual Appflow server will provide with the relevant data, providing real-time information on URL Latency, status and error codes, HTTP methods, and so forth.
The bottom has a compact listing of relevant sites and the simple breakdown of the tracked data for them – which sites are receiving what portion of traffic, latency for those sites, traffic in data sent, number of requests, and so forth.
Additionally, there's a handy visual chart about to provide a swift and intuitive glimpse of current status – whatever that may be!
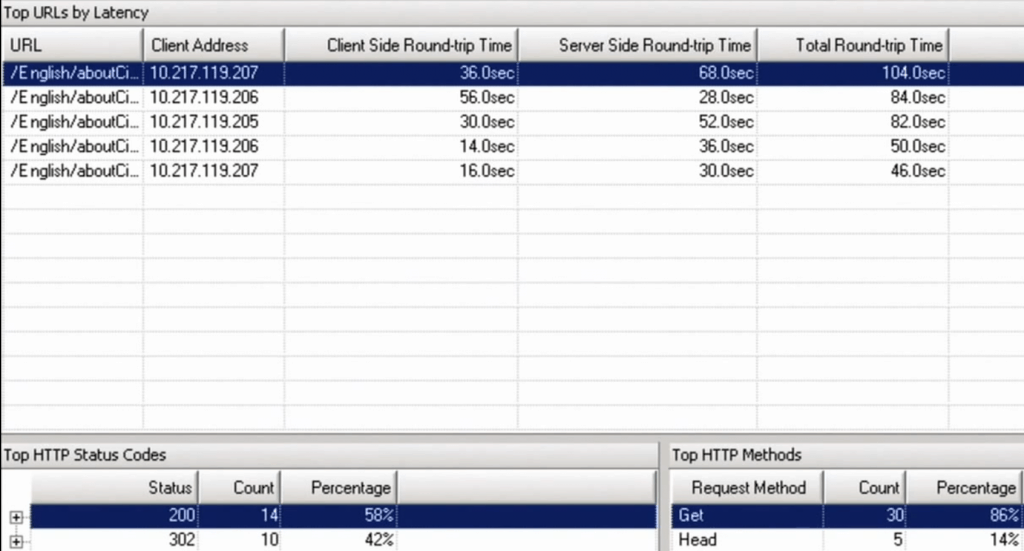
The main screen already shows an overview for supported devices and domains, as seen above but once expanded, selecting an actual Appflow server will provide with the relevant more granular data, providing real-time information on URL Latency, status and error codes, and HTTP methods, all of which were discussed above.
This one screen provides the awesome trifecta of information all in one spot., as shown below.
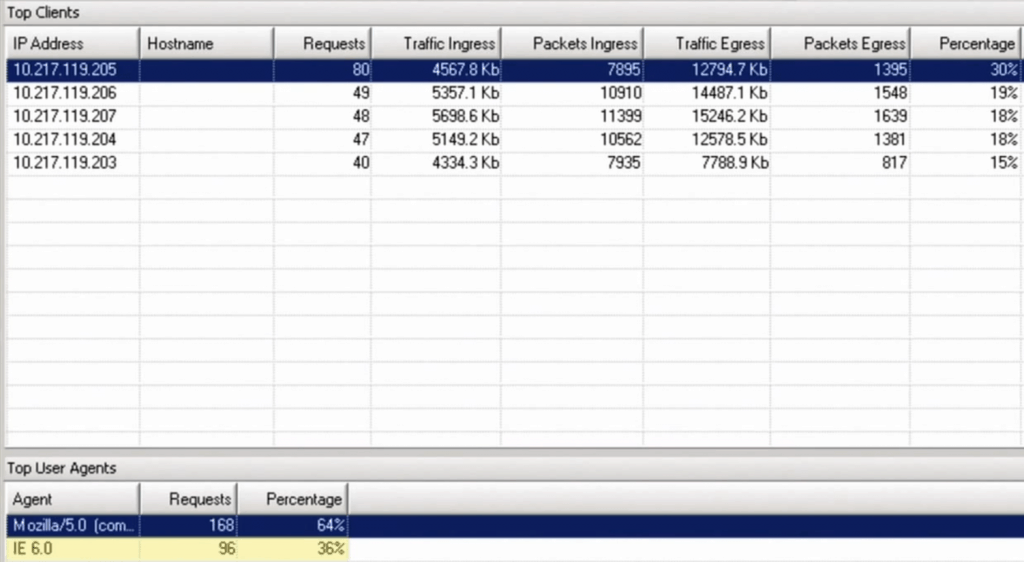
In addition to that, under the same Citrix Appflow menu is another option, “Clients.” The clients view is an even more granular breakdown o traffic by IP Address, requests, ingress/egress, and also has a user agent portion at the bottom.
This particular screen isn't something that normally will have anything especially unusual – and in fact, it's only when it does that it would generally be of significant concern!
Users with browser specific issues, or staggeringly high ingress/egress, could suggest some kind of browser error or problem to resolve, or some kind of malicious activity.
It's hard to say what, but easy to look at this data and sometimes be able to say “something is amiss” and know to investigate further.
Flow tracking in all of its forms is not only important because of stability and uptime, but also maintenance and prevention of downtime or other issues.
A technician constantly only responding to problems is one who should spend more time preventing those problems – and Appflow is one of the best tools to aid in doing precisely that.
Being able to spot trends or errors before they reach a catastrophic point is the only way to stay ahead of the game – a byte of updates and maintenance is worth a kilobyte of troubleshooting and repair, as they say.


Download Now!