
Our funding comes from our readers, and we may earn a commission if you make a purchase through the links on our website.
ApexSQL Monitor Review for SQL Server Monitoring & Management
UPDATED: October 13, 2022
ApexSQL Monitor is a Windows and SQL Server monitoring tool with a wide range of monitored metrics. It tracks Windows, SQL Server, AlwaysOn Availability Group and Failover Cluster instances, and database metrics on multiple local and remote machines and SQL Server instances.
It can monitor wait statistics at SQL Server and the individual query level, as well as a query wait statistics on cumulative and individual query level. ApexSQL Monitor also allows a DBA to set up and receive wait stats alert notifications.
The following are the Key features of ApexSQL Monitor
- Historical trends and resource correlations for SQL server tuning
This feature allows DBAs to analyze historical database performance, to compare the performance in different time periods and to establish correlation between that data and database performance trends over the time - Drill down ability with time slicing for detailed performance analytics
This offers the ability to drill down through collected performance data and narrow down the specific period of interest to identify and analyze the top performance issues with up to 15 seconds precision - Alerting and baselines
This provides comprehensive alerting abilities which allow users to fine-tune alerting thresholds or to use historical data for baselining, for more precision alerting and as a reference for subsequent comparative analysis of measurements - Reporting ability
ApexSQL Monitor generates reports with information about the monitored system and on collected metrics data with the highest impact on the monitored SQL Servers - Performance metrics information and tuning advice
This information about system/SQL server metrics and wait stats type specifics includes expert advice on how to handle the underlying issues - Agentless application architecture with less than 1% overhead
ApexSQL Monitor does not require anything to be installed on the monitored server or on the computer that hosts the monitored SQL Server. The carefully optimized application engine ensures that load imposed on the monitored server stays within 1% of CPU usage on the monitored server
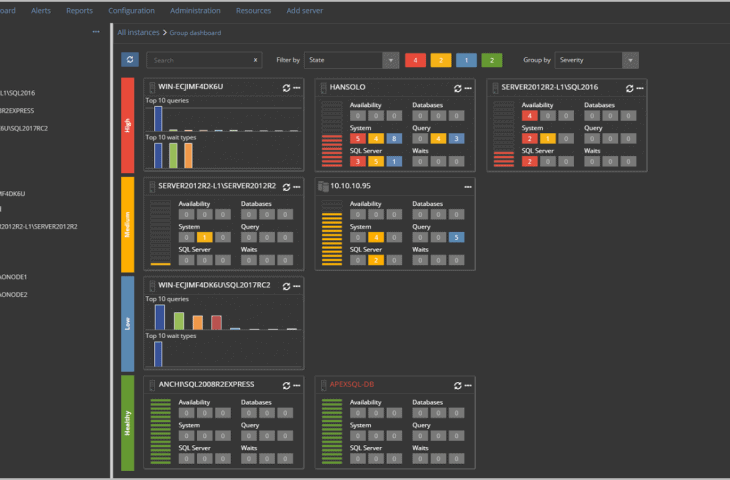
In the main dashboard, the user can review monitoring information summary about all currently monitored instances including alerts for each performance category.
The instance dashboard of the selected SQL Server displays information about Windows operating system and hardware, including the number of alerts and severity per each of six performance groups.
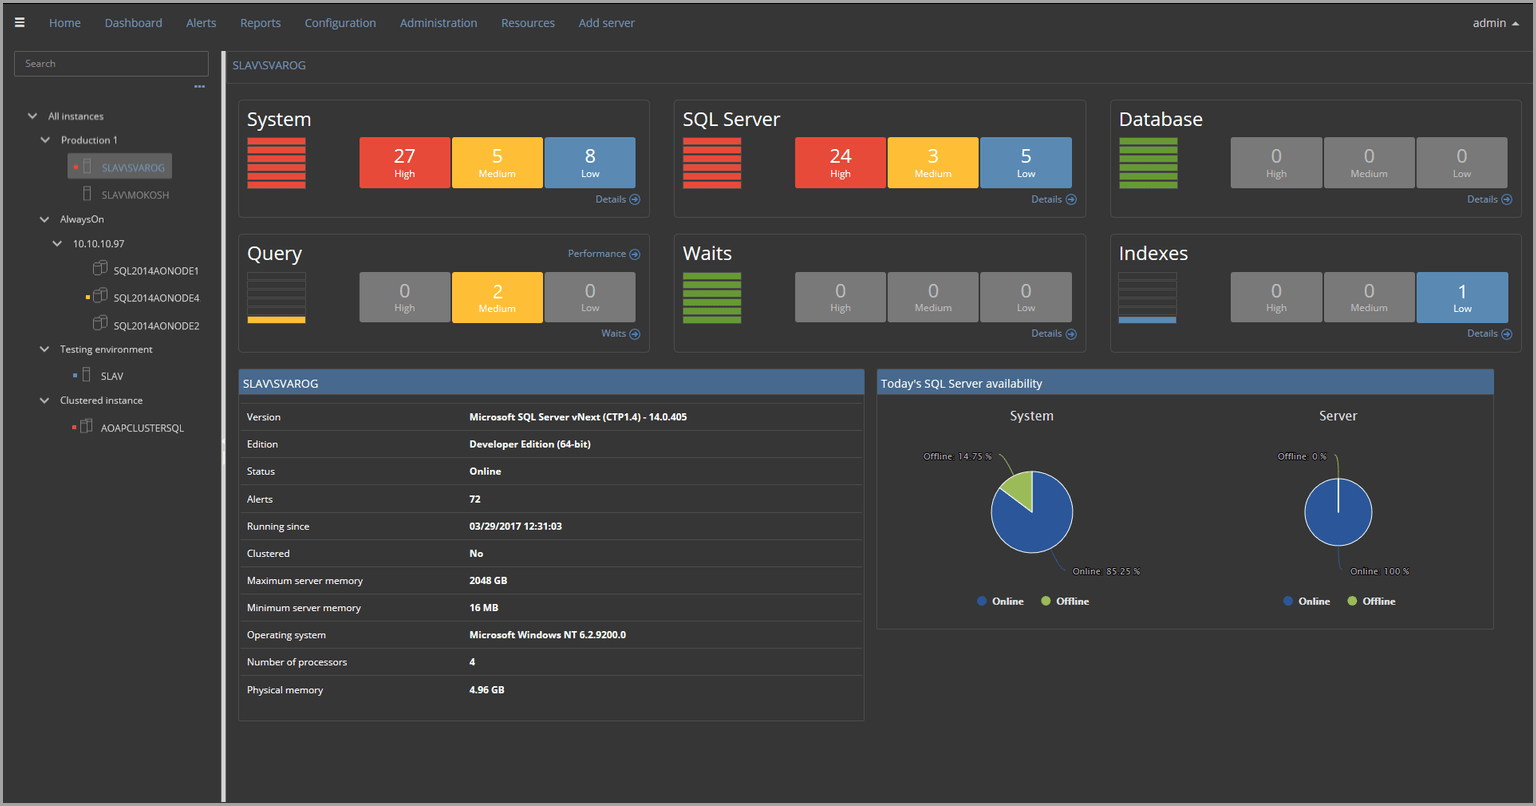
The instance dashboard allows for easy drill down to specific alerts or each performance monitoring category by clicking on the appropriate link
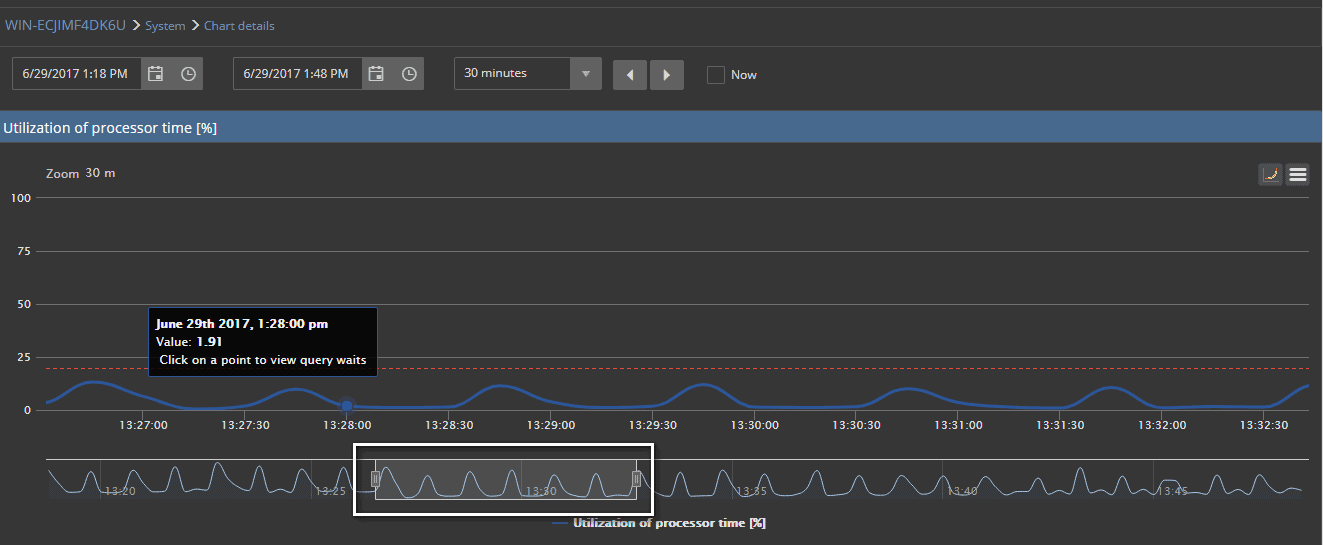
Users can customize the view to a specific period by moving the slider below the chart which allows for a detailed view with easily distinguishable data values in the specific time frame
Choosing the AlwaysOn availability group listener in the instance explorer, displays the AlwaysOn dashboard. The AlwaysOn dashboard allows insight into a full structure of Windows Server Failover Cluster and AlwaysOn AG for a complete environment. AlwaysOn topography includes related availability groups not explicitly added for monitoring, though performance data do not collect for those
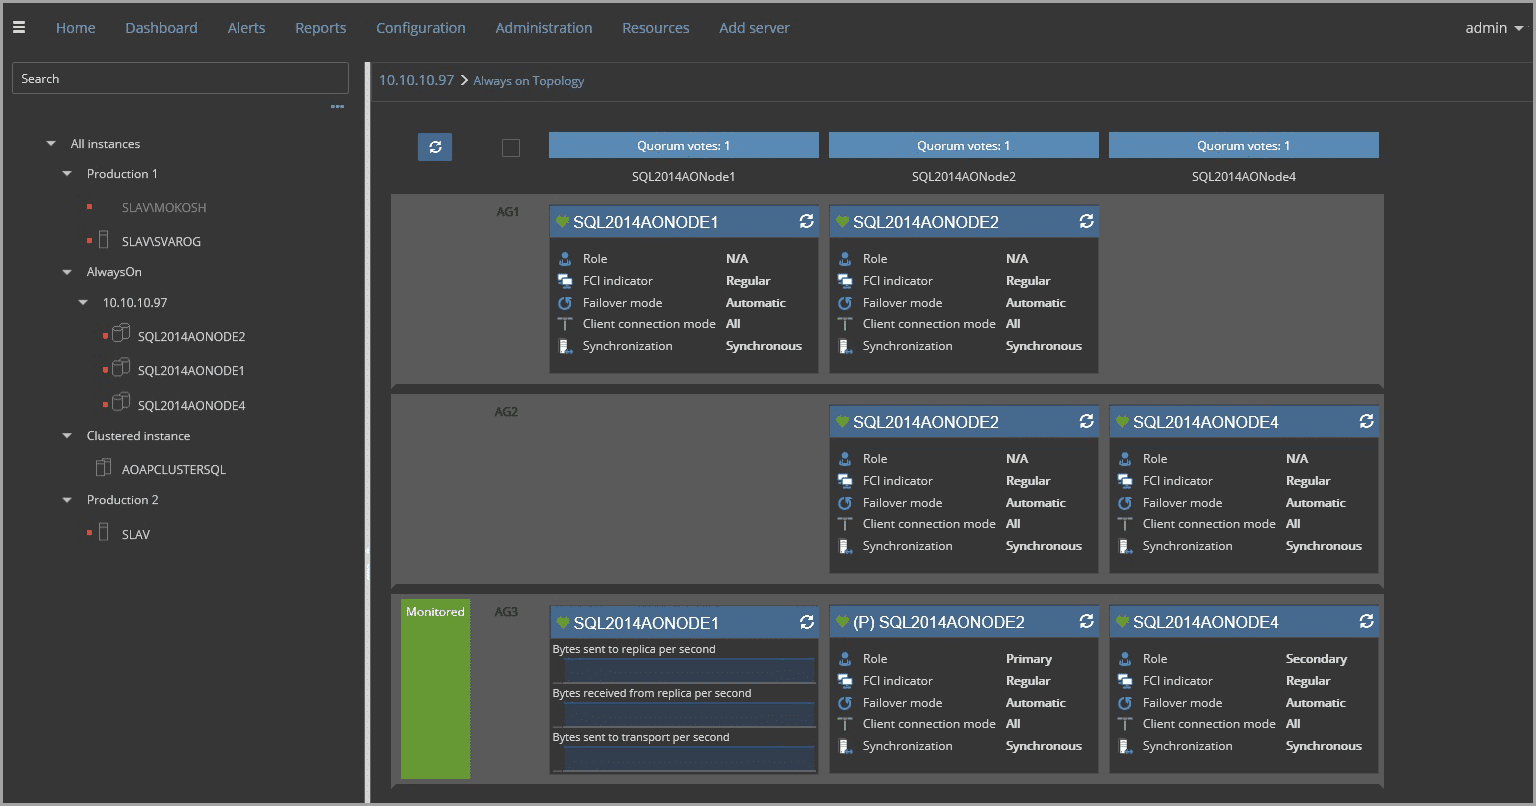
The graphically displayed AlwaysOn topology contains the essential AlwaysOn metrics as charts on one side of the panel and AlwaysOn replica specific info on another side of the panel.
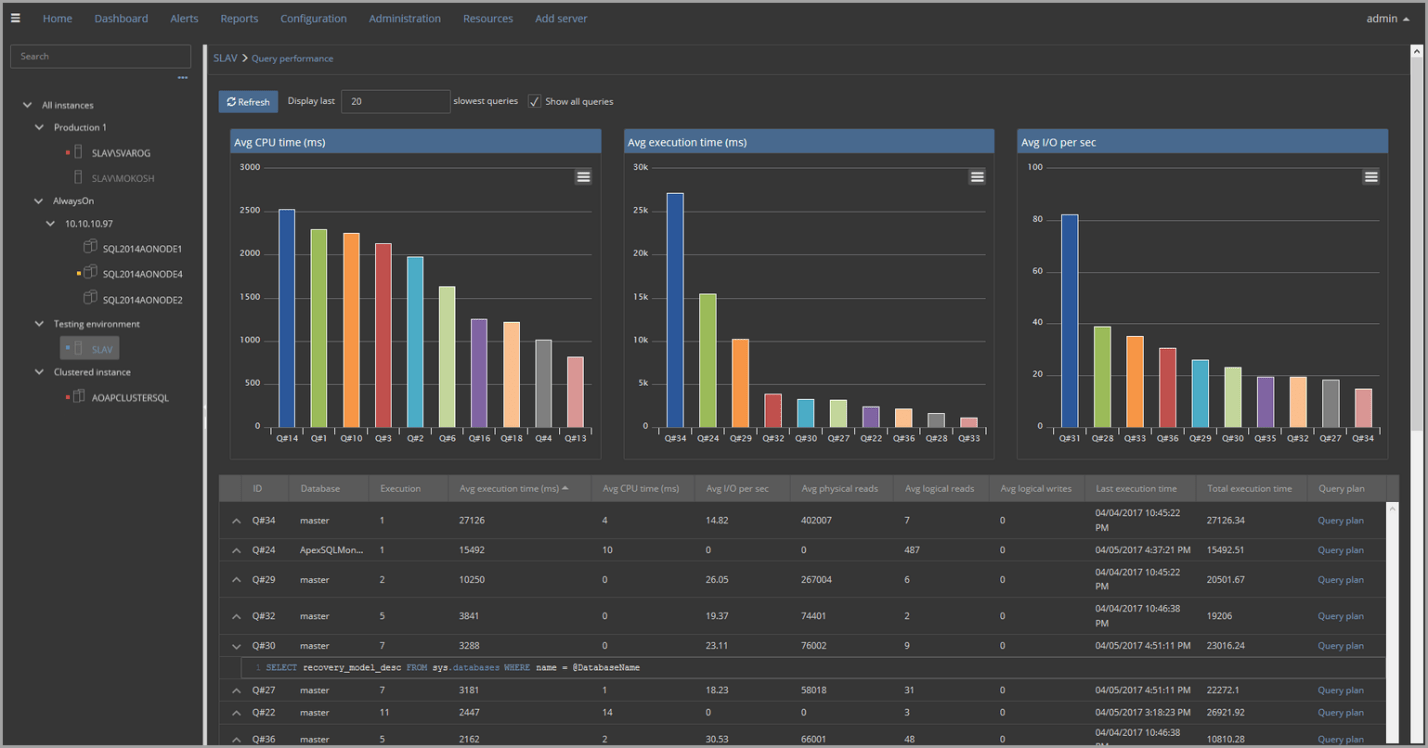
The Query performance feature is designed specifically to display the slowest running queries. Any performance degradation of problematic queries can be evaluated, not only by the execution time but also by average CPU usage average I/O activity. Information and details about slowest running queries are retrieved directly from the SQL Server dynamic management views.
The Query Waits for page highlights slow running queries which often cause SQL Server performance issues:

The feature allows displaying each single query execution in the selected period. Expanding a specific query, in the grid, provides additional details including wait types, wait time, query related performance data and more:
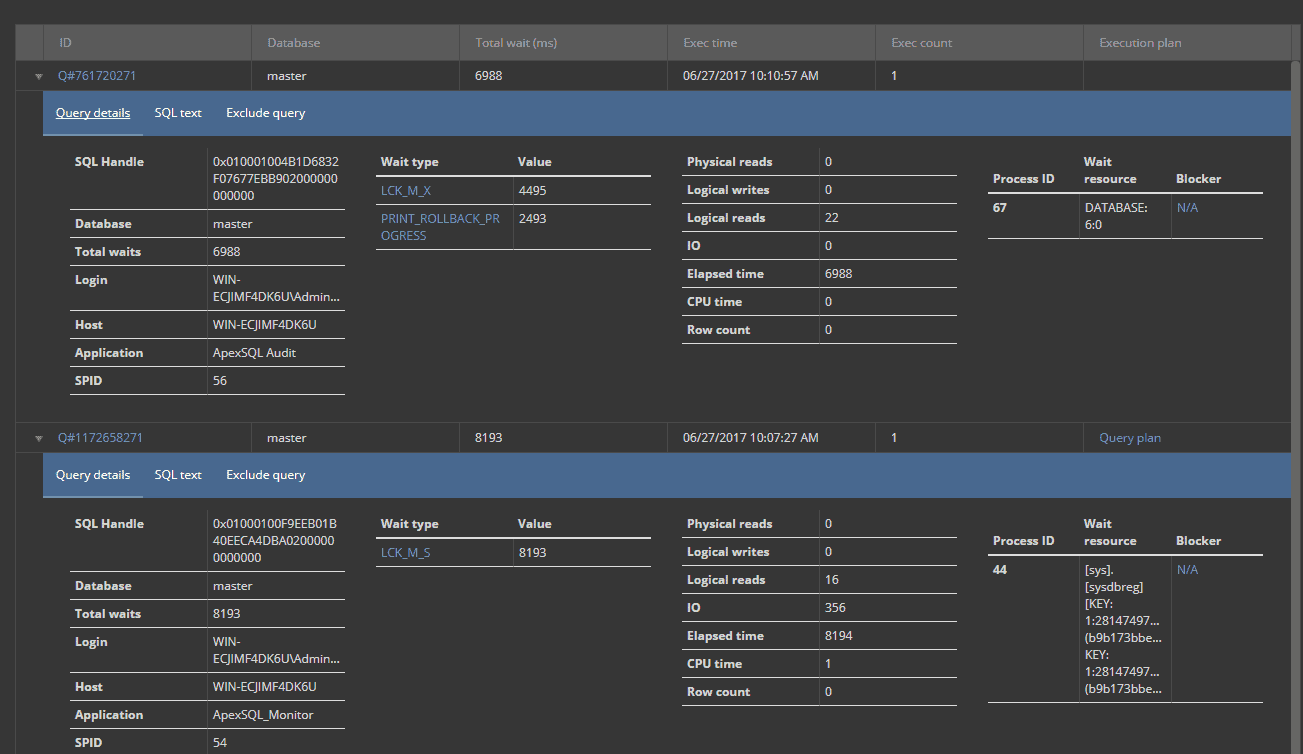
For even more detailed information about the query, clicking on the query name hyperlink opens the query details page with more details and a historical statistics for that particular query.

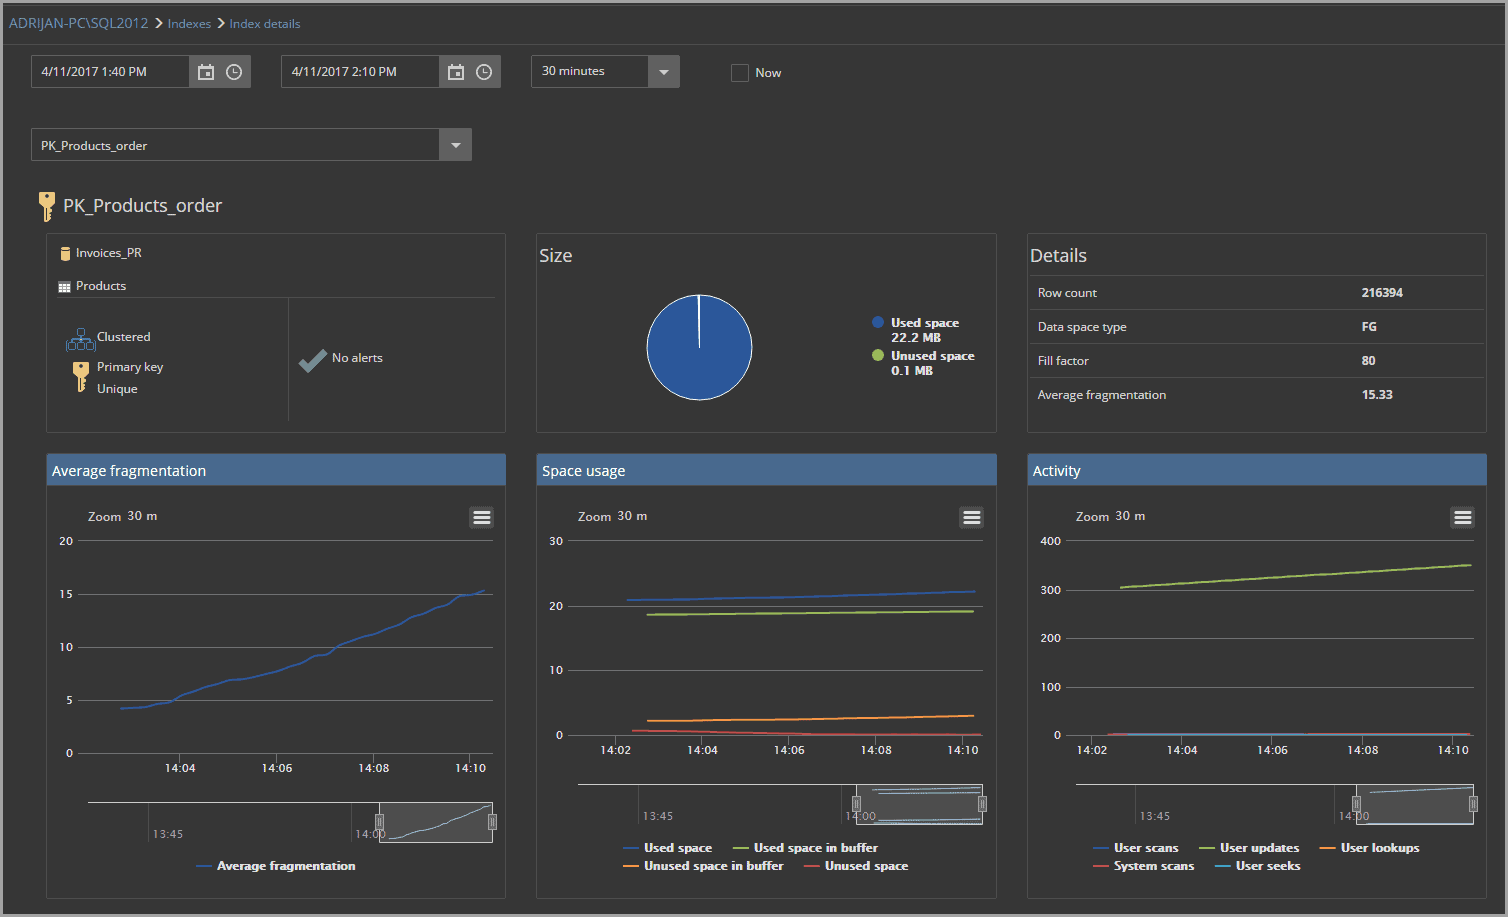
The Index monitoring module displays a table with a list of the indexes that meet the criteria configured by the user in the index configuration page:
The Alerts triggered on a specific SQL Server instances can be reviewed in the Alerts module:
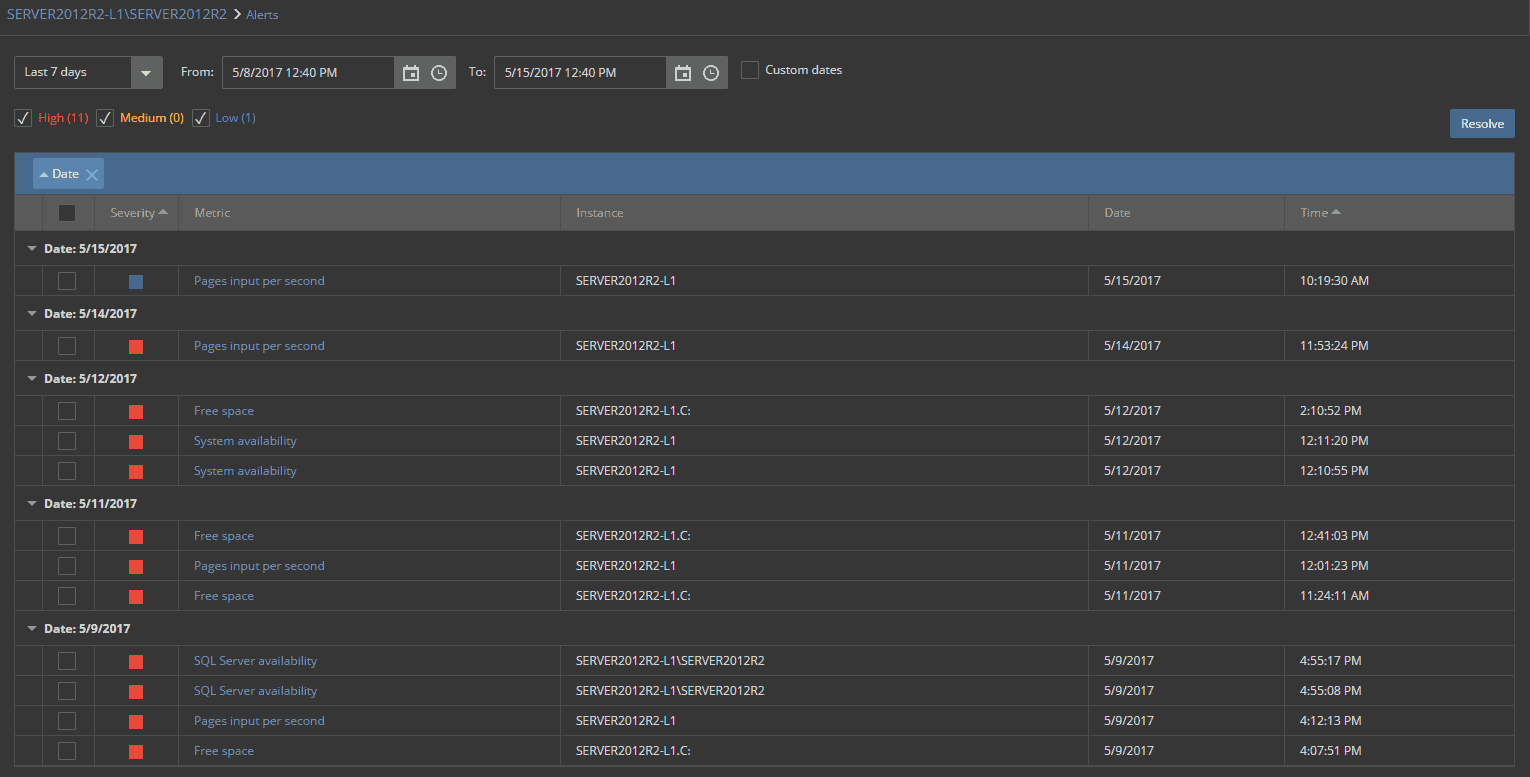
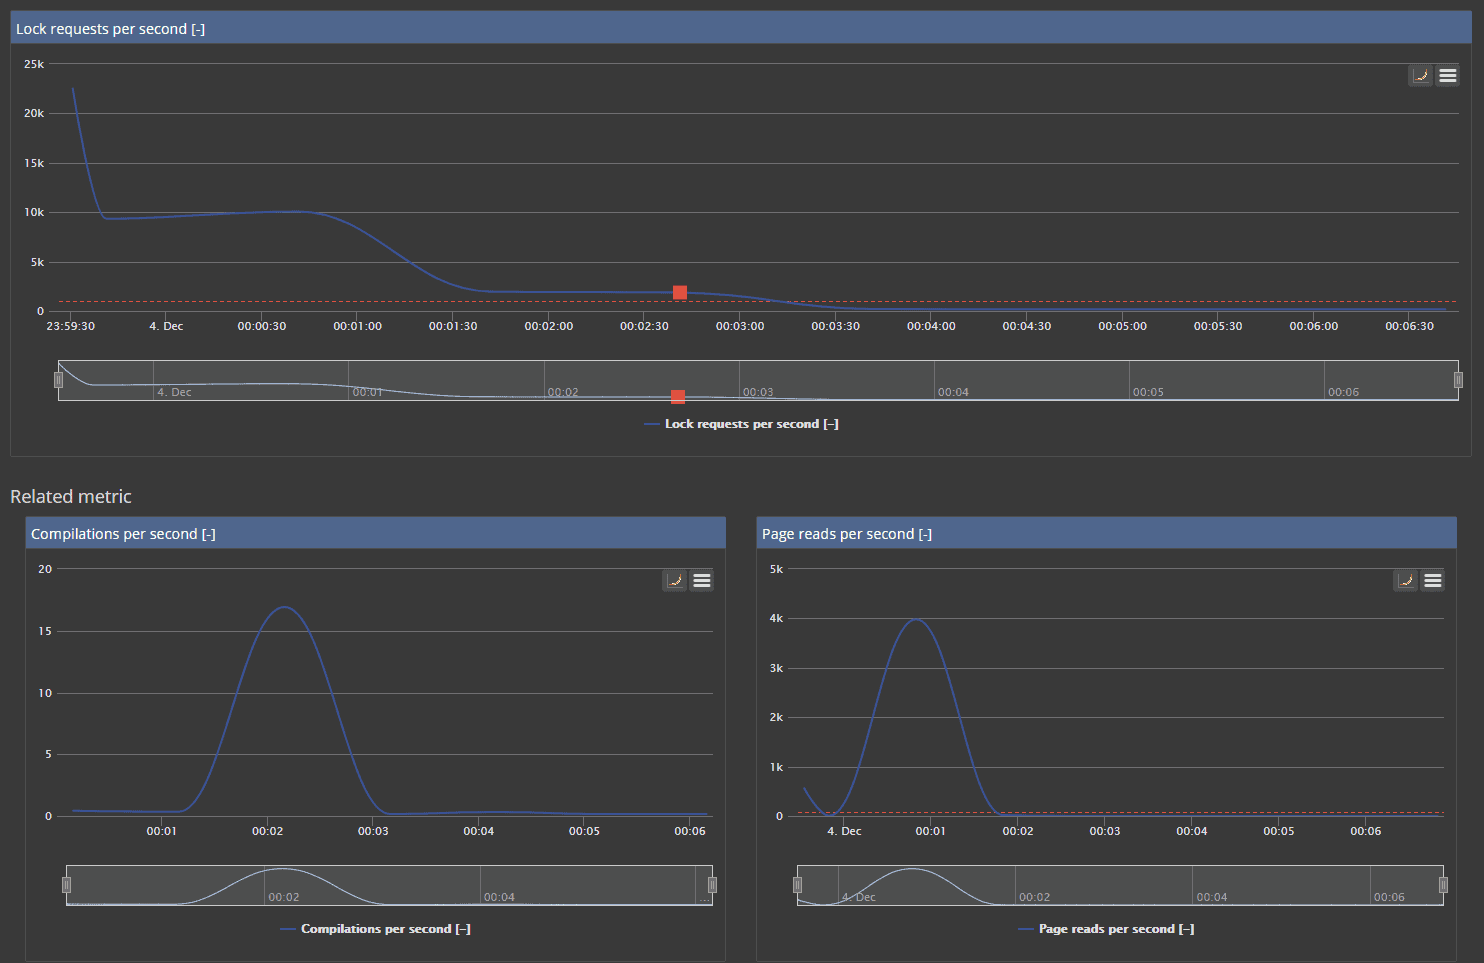
Drilling down to a particular alert, in the list, opens an individual alert page with the affected metric chart with exact time when the alert was raised marked on the chart. Besides displaying the alerted metric, ApexSQL Monitor displays on the same page the metric which behavior changed immediately before, during or after the original alert is triggered, allowing better insight into potentially related causes or consequences of the triggered alert:
This quick overview is just the part of ApexSQL Monitor’s performance monitoring abilities. For better insight into the application abilities, visit the product page and/or download a fully functional trial.
Pros:
- A great solution for enterprise-sized organizations
- Supports data replacement without rollbacks
- Uses a sleek and scalable interface
- Allows simple steps to BDR and dropped table replacement
Cons:
- Is priced higher than similar tools on the list
Official Site and Download: https://www.apexsql.com/sql_tools_monitor.aspx


Download Now